





fx technical outlook 1528572015
<p>Technical Developments to Watch: · EUR/USD bulls may look to target further upside at or above 1.1450 resistance after rally on weakened dollar · GBP/USD […]</p>
Share this:

Technical Developments to Watch:
· EUR/USD bulls may look to target further upside at or above 1.1450 resistance after rally on weakened dollar
· GBP/USD facing resistance and could turn lower back towards 1.5000
· USD/JPY moving average “death cross” and tight triangle consolidation still in play
· USD/CAD bounce possible around or above 1.2800 support
EUR/USD
The past week saw EUR/USD continue its steady climb on a weakened US dollar. The upper border resistance of the current consolidation is around the 1.1450 level. Bulls may look to further target that level and above on a continued dollar pullback. Any sustained rise above 1.1450 could switch momentum back to the bulls as EUR/USD looks to recover possibly towards the 1.1700 highs. Major support remains at the 1.1100 level and 200-day moving average.
GBP/USD
GBP/USD climbed in the past week from below 1.5200 up to approach the 1.5400 level. In the process, the currency pair has reached back up to its relatively flat and closely-situated 200-day and 50-day moving averages. With any further rebound momentum, major resistance lies at the 1.5500 level. But at or below that level, a turn back down to 1.5200 should once again begin targeting the 1.5000 psychological support objective.
USD/JPY
USD/JPY has continued to range-trade in a converging consolidation, otherwise known as a triangle pattern. This pattern has been in place since late August. Of particular note from a technical perspective, the 50-day moving average has recently crossed below the 200-day moving average, creating a potential “death cross” technical scenario that could presage further downside for USD/JPY in the event of a return to global market volatility and a potential flight to the yen. On any breakdown below the triangle pattern, the currency pair could then target the next major objectives at the 118.00 and then 116.00 support levels. Upside resistance on any sustained trading above 120.00 continues to reside around the upper border of the noted triangle pattern.
USD/CAD
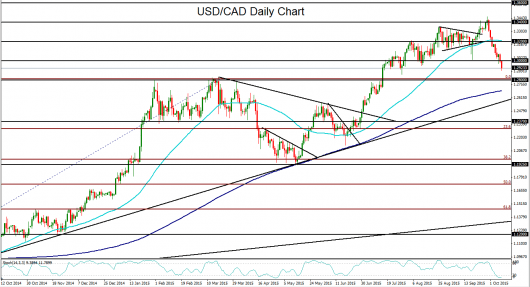
USD/CAD has spent the past couple of weeks plunging from late September’s 11-year high of 1.3456. This sustained drop has been the result of rebounding crude oil prices combined with a pullback in the US dollar. Having broken down below the 1.3000 psychological support level, USD/CAD could be poised for further downside as perceptions of a more dovish Fed weigh on the US dollar and help give a further boost to crude oil. At the same time, however, major support continues to loom directly below around the 1.2800 level, which represents the previous long-term highs before the upside breakout in mid-July. On any continued move down to approach 1.2800, USD/CAD should find support and a possible rebound and recovery after its recent sharp slide.
Related tags:



Open an account in minutes
Experience award-winning platforms with fast and secure execution, and enjoy tight spreads from 0.5 pts on FX and 0.3 pts on indices.
Economic calendar
Web Trader platform
Our sophisticated web-based platform is packed with features.
Related articles
This report is intended for general circulation only. It should not be construed as a recommendation, or an offer (or solicitation of an offer) to buy or sell any financial products. The information provided does not take into account your specific investment objectives, financial situation or particular needs. Before you act on any recommendation that may be contained in this report, independent advice ought to be sought from a financial adviser regarding the suitability of the investment product, taking into account your specific investment objectives, financial situation or particular needs.
StoneX Financial Pte. Ltd., may distribute reports produced by its respective foreign entities or affiliates within the StoneX group of companies or third parties pursuant to an arrangement under Regulation 32C of the Financial Advisers Regulations. Where the report is distributed to a person in Singapore who is not an accredited investor, expert investor or an institutional investor (as defined in the Securities Futures Act), StoneX Financial Pte. Ltd. accepts legal responsibility to such persons for the contents of the report only to the extent required by law. Singapore recipients should contact StoneX Financial Pte. Ltd. at 6826 9988 for matters arising from, or in connection with the report.
In the case of all other recipients of this report, to the extent permitted by applicable laws and regulations neither StoneX Financial Pte. Ltd. nor its associated companies will be responsible or liable for any loss or damage incurred arising out of, or in connection with, any use of the information contained in this report and all such liability is hereby expressly disclaimed. No representation or warranty is made, express or implied, that the content of this report is complete or accurate.
StoneX Financial Pte. Ltd. is not under any obligation to update this report.
Trading CFDs carries a high level of risk that may not be suitable for some investors. Consider your investment objectives, level of experience, financial resources, risk appetite and other relevant circumstances carefully. The possibility exists that you could lose some or all of your investments, including your initial deposits. If in doubt, please seek independent expert advice. Visit www.forex.com/en-sg/terms-and-policies for the complete Risk Disclosure Statement.