



Global Indices: January ‘down’, 11-months to go
Global equity markets were mostly lower in January. But even the few that posted gains had to endure a white-knuckle ride along the way.
Share this:
January did not deliver the returns many had hoped. Red-hot inflation prints, a hawkish Fed and rising tensions between Russia and Ukraine proved too much for equity bulls and saw investors flock towards the exit. Yet the truth of the matter is that much of this selling began late December during low-volume trade, only to see economic data and headlines trigger the next round of selling mid-January.
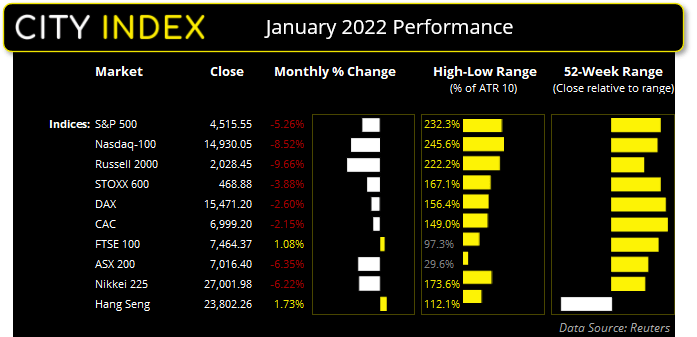

Technology stocks led the decline with the Nasdaq 100 facing its worst January since 2008. It was the first major benchmark to enter an official correction of -10%, and it has fallen over -18% from its record high in November to this month’s low. The S&P 500 fell -5.25% in January, although it initially fell -12.4% from its January high before a late-month recovery.
Europe didn’t fare so badly as their US counterparts, as prospects of the Fed tightening alongside a dovish ECB provided a less bearish narrative. It could be argued that geopolitical tensions surrounding Russia played the better part in forcing the STOXX 600 nearly -4% lower in January, compared to just -2.6% for the DAX.
And that leaves the January outperformer as the Hang Seng. A slew of weak economic data from China alongside easing measures from PBOC (People’s Bank of China) helped the Hang Seng shake off much of the bearish volatility. In fact, it is one of the few indices to have closed higher by around +1.7% in January. With that all said, it is interesting to note how Wall Street bounced on the last day of January which makes us question whether we have seen the corrective lows, or it is simply part of a dead-cat bounce.
Nasdaq 100
The Nasdaq 100 found support just above a 161.8% Fibonacci projection on January 24th. The January lows also coincide with a 38.2% Fibonacci retracement ratio and prices have since rallied out of a choppy, sideways congestion zone. RSI (14) is no longer oversold and a bullish divergence formed on the Stochastic oscillator. We therefore expect the market could trade higher from here, although we also need to see prices break above the 200-day MA (moving average) and the 15,000 level before assuming further gains.


Nikkei 225
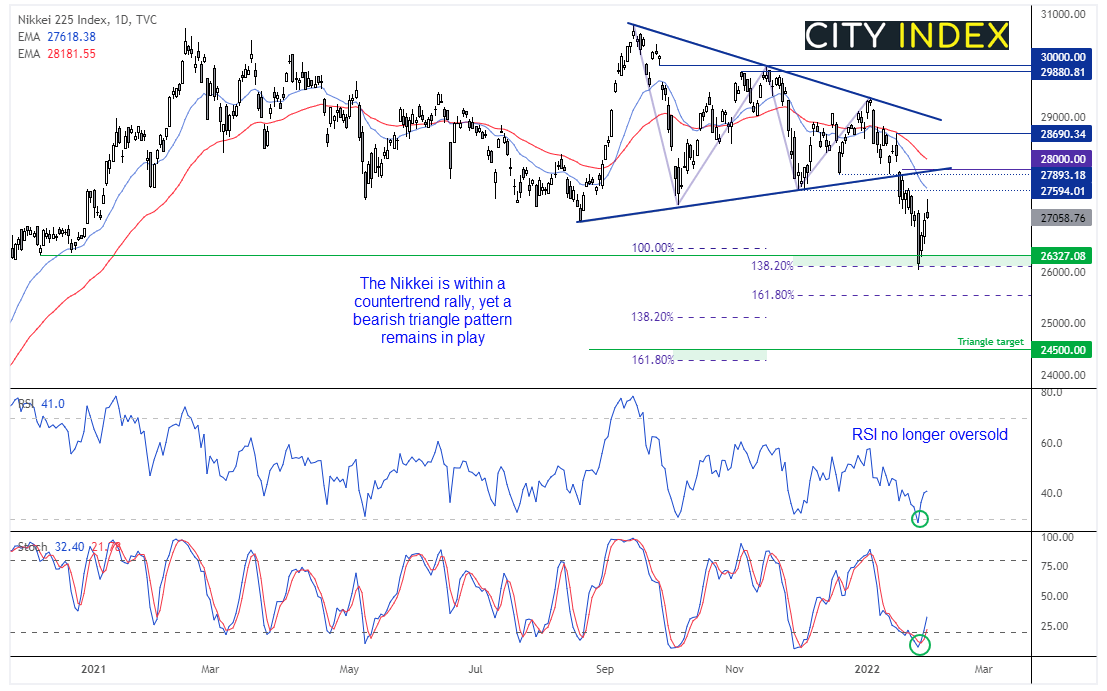
If the Nasdaq continues to bounce is could also provide further tailwinds for the Nikkei 225, due to the large proportion of technology stocks in Japan’s prime index. The RSI (14) has also rose with prices and out of the ‘oversold’ zone of 30 and the stochastic oscillator generated a buy signal. However, price action overall retains a bearish structure as it broke out of a bearish triangle on January 19th. If successful the triangle targets the area around 24,500, near a 161.8% Fibonacci level. Whilst the jury remains out as to whether the Nasdaq can trade back to its all-time highs, we continue to suspect the upside potential for the Nikkei is limited and are seeking bearish setups around key resistance levels.
Read our guide on the Nikkei 225 trading guide
Read our guide on the Nikkei 225 trading guide

How to trade with City Index
You can easily trade with City Index by using these four easy steps:
- Open an account, or log in if you’re already a customer
• Open an account in the UK
• Open an account in Australia
• Open an account in Singapore
- Search for the company you want to trade in our award-winning platform
- Choose your position and size, and your stop and limit levels
- Place the trade
How to trade with FOREX.com
Follow these easy steps to start trading with FOREX.com today:
- Open a Forex.com account, or log in if you’re already a customer.
- Search for the pair you want to trade in our award-winning platform.
- Choose your position and size, and your stop and limit levels.
- Place the trade.
Related tags:


Open an account in minutes
Experience award-winning platforms with fast and secure execution, and enjoy tight spreads from 0.5 pts on FX and 0.3 pts on indices.
Economic calendar
Web Trader platform
Our sophisticated web-based platform is packed with features.
Related articles
Crude Oil Q4 2026 Outlook: Will a New Energy-Security Regime Emerge?
Crude Oil Q4 2026 Outlook: The U.S.-Iran conflict has done more than disrupt oil flows. It has challenged many of the assumptions underpinning the global energy security system established after the 1973 oil embargo.

WTI crude squeezed between Hormuz risk and diesel ban speculation
WTI is being pulled in opposite directions as Hormuz risk collides with growing political pressure over US diesel prices.


Gold Outlook: XAU/USD hit hard as US yields, dollar resume ascent
A stronger dollar, surging front-end yields and renewed geopolitical tension have combined to push gold back towards key technical support.
This report is intended for general circulation only. It should not be construed as a recommendation, or an offer (or solicitation of an offer) to buy or sell any financial products. The information provided does not take into account your specific investment objectives, financial situation or particular needs. Before you act on any recommendation that may be contained in this report, independent advice ought to be sought from a financial adviser regarding the suitability of the investment product, taking into account your specific investment objectives, financial situation or particular needs.
StoneX Financial Pte. Ltd., may distribute reports produced by its respective foreign entities or affiliates within the StoneX group of companies or third parties pursuant to an arrangement under Regulation 32C of the Financial Advisers Regulations. Where the report is distributed to a person in Singapore who is not an accredited investor, expert investor or an institutional investor (as defined in the Securities Futures Act), StoneX Financial Pte. Ltd. accepts legal responsibility to such persons for the contents of the report only to the extent required by law. Singapore recipients should contact StoneX Financial Pte. Ltd. at 6826 9988 for matters arising from, or in connection with the report.
In the case of all other recipients of this report, to the extent permitted by applicable laws and regulations neither StoneX Financial Pte. Ltd. nor its associated companies will be responsible or liable for any loss or damage incurred arising out of, or in connection with, any use of the information contained in this report and all such liability is hereby expressly disclaimed. No representation or warranty is made, express or implied, that the content of this report is complete or accurate.
StoneX Financial Pte. Ltd. is not under any obligation to update this report.
Trading CFDs carries a high level of risk that may not be suitable for some investors. Consider your investment objectives, level of experience, financial resources, risk appetite and other relevant circumstances carefully. The possibility exists that you could lose some or all of your investments, including your initial deposits. If in doubt, please seek independent expert advice. Visit www.forex.com/en-sg/terms-and-policies for the complete Risk Disclosure Statement.