



Gold: Inflation hedge or Inflation expectations hedge?
The next direction in Gold will depend on the Omicron variant and market expectations of how the virus may change the Fed’s thinking at the next meeting
Share this:

Over time, Gold (XAU/USD) has been considered a hedge to rising inflation. And although that may be true over the course of the long-term, its not always true in the short term. As inflation rises, Gold tends to rise as well. However, the price of Gold in the short term tends to move on inflation expectations, rather than the headline inflation. In addition, the injection of headlines into the news also causes Gold to move (just as with many other instruments). Over the last 22 months, the consistent headlines that have been moving the price of Gold has obviously been the coronavirus. When a new mutation of the coronavirus is discovered or the number of new cases is rising, the price of Gold will rise (negative headlines). When vaccination rates rise, the price of Gold may fall.
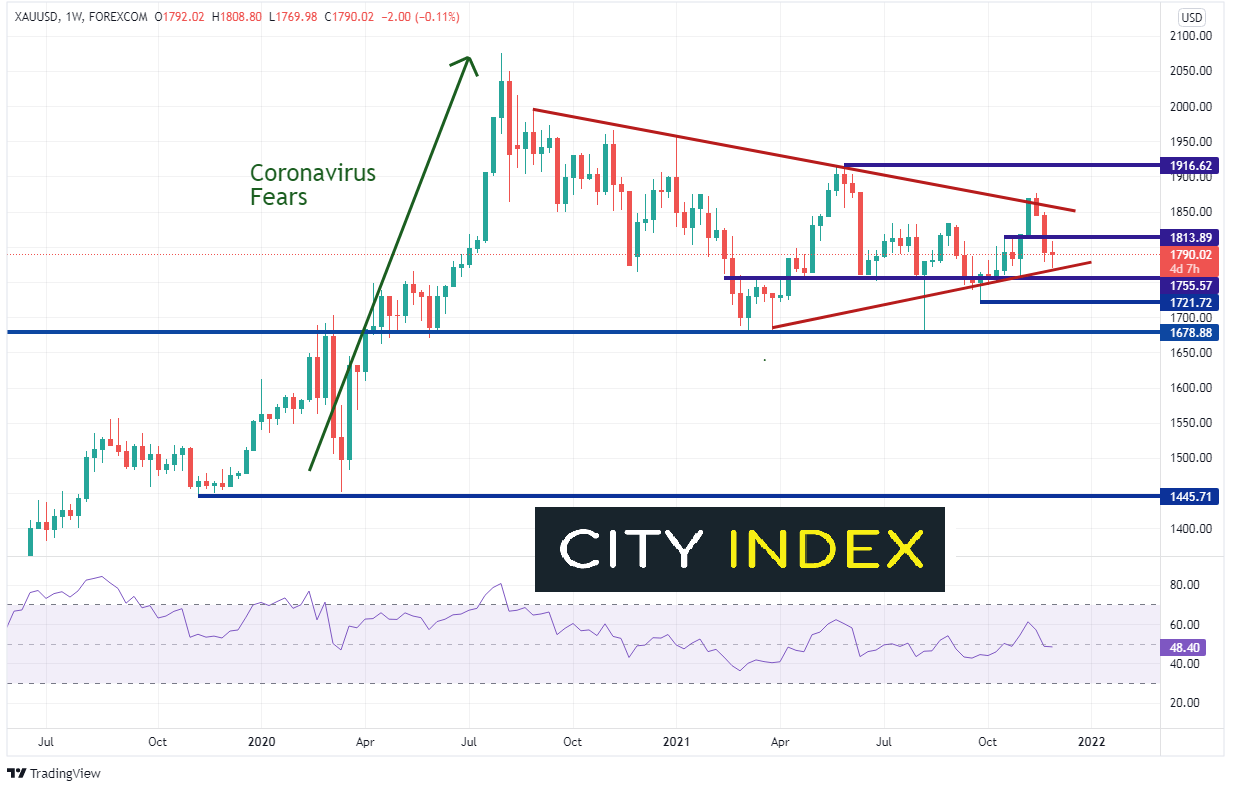
On March 20, 2020, Gold began moving higher off support as fear gripped the markets with the emergence of the coronavirus. Gold was truly a flight to safety for the next four and a half months. During the week of August 3rd, 2020, price printed a new, all-time high of 2075.11, a move of nearly 43%! At the time, central banks were pumping the world with stimulus, as they waited for positive news on the virus. The RSI moved into overbought territory; the Gold pulled back into a consolidation triangle.

Source: Tradingview, Stone X
Trade Gold (XAU/USD) now: Login or open a new account!
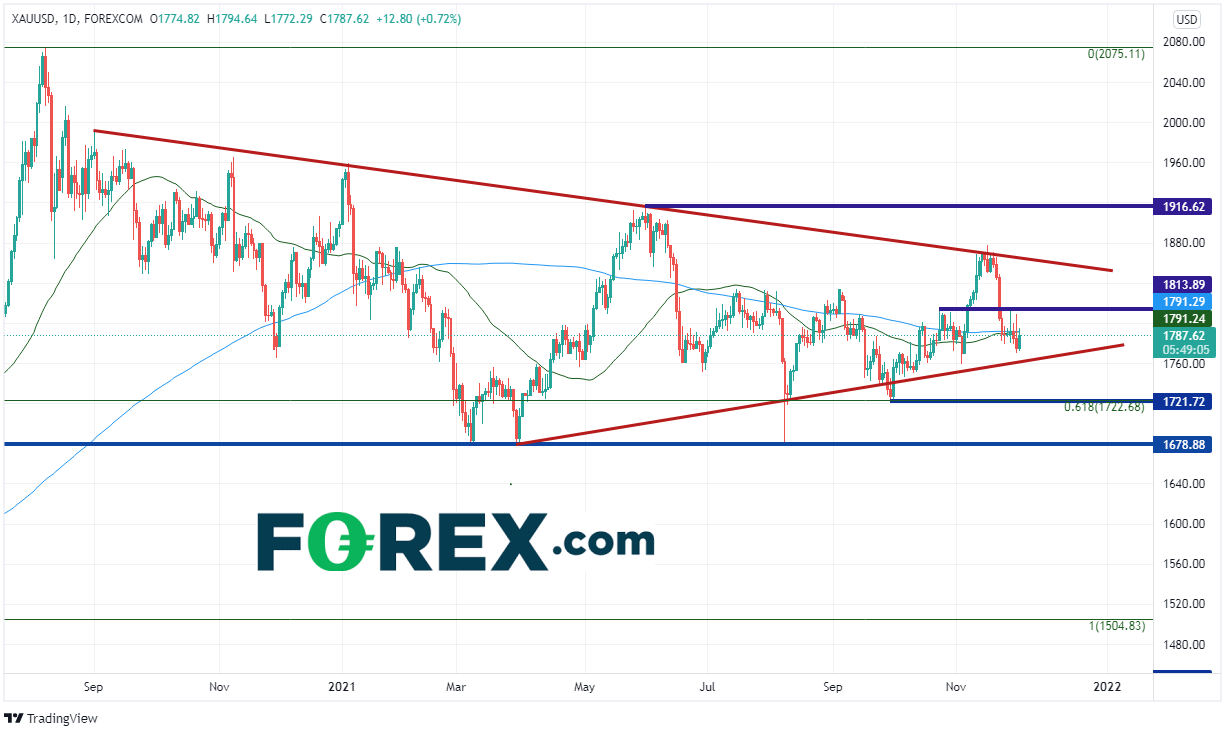
The price of Gold pulled back to 61.8% Fibonacci retracement level from the March 2020 lows to the August 2020 highs at 1722.68 and has briefly spiked below it 3 times since then. The precious metal has been consolidating in a corrective triangle since the all-time highs and is currently approaching the apex of the triangle.
Source: Tradingview, Stone X
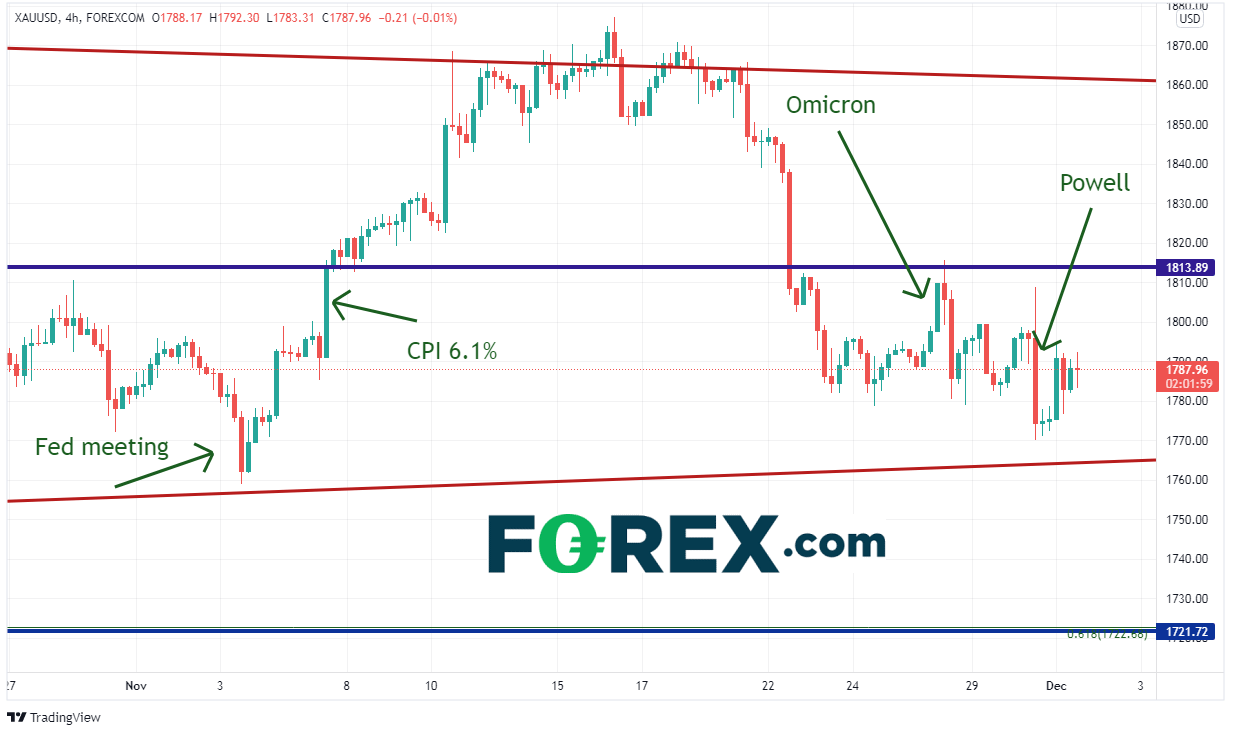
On the 240-minute timeframe, Gold put in a low near the bottom trendline of the long-term triangle (red) near 1758.5, as the Fed announced they would begin tapering its bond buying program at a pace of $15 billion per month. This was not a surprise, as markets had been expecting this result. The move into the low was more of a “Sell the rumor, buy the fact” trade. Gold began moving higher as a result, and shorts were quickly stopped out. A few days later, on November 10th, the US released headline CPI at 6.1% YoY. Gold continued to move higher on expectations of higher inflation AND that the Fed wasn’t doing enough to slow the pace of the increase. Recall that until recently, the Fed had considered inflation to be “transitory”. Gold briefly moved about the upper trendline of the consolidating triangle (red), only to be rejected near 1877.5 .
Source: Tradingview, Stone X
Gold began moving lower again in the triangle, as no less than 4 Fed speaks hinted that the Fed may need to increase the pace of tapering bond purchases. If the pace of bond purchases increase, then inflation would lower. Thus, inflation expectations moved lower, which caused the price of Gold to move lower as well! When the Omicron variant of the coronavirus was first “announced”, Gold did indeed go bid from 1788.7 to resistance at 1815.6. However, sellers entered the market at resistance and pushed price lower as markets worried less and less about inflation. On Tuesday, Powell confirmed what the markets were already thinking: The increase in the pace of bond purchases may be ahead. Powell “retired” the word transitory. Gold initially sold off, however bounced back on a “sell the news, buy the fact” trade.
Where is Gold headed now?
With fears of higher inflation dwindling in the market, the direction of Gold will most likely be dependent on the Omicron variant. If data over the next 2 week shows that the virus will slow growth over the coming months, the price of Gold should increase. This may lead to lower expectations that the Fed will increase the pace of tapering at the next meeting, which would also push the price of Gold higher. However, if Omicron can be contained, the Fed should increase the taper, which would cause Gold to move lower.
Notice that price is approaching the apex of the triangle and consolidating at both the 50- and 200- Day Moving Averages at 1791. Resistance is at the recent highs near 1815.5. A close above would indicate a possible move back toward top trendline of the long-term triangle and recent highs near 1877. Horizontal resistance above there is at 1916.6. Support is at recent lows and the bottom, upward sloping trendline of the triangle near 1770. Below there is the previously mentioned long-term 61.8% Fibonacci retracement and horizontal support at 1721.72, then the triple bottom lows at 1678.9.
Gold has been consolidating towards the apex of a long-term triangle between 1770 and 1877. The next direction in Gold will depend on the Omicron variant and market expectations of how the virus may change the Fed’s thinking at the next meeting on December 15th and 16th.
Learn more about forex trading opportunities.
Over time, Gold (XAU/USD) has been considered a hedge to rising inflation. And although that may be true over the course of the long-term, its not always true in the short term. As inflation rises, Gold tends to rise as well. However, the price of Gold in the short term tends to move on inflation expectations, rather than the headline inflation. In addition, the injection of headlines into the news also causes Gold to move (just as with many other instruments). Over the last 22 months, the consistent headlines that have been moving the price of Gold has obviously been the coronavirus. When a new mutation of the coronavirus is discovered or the number of new cases is rising, the price of Gold will rise (negative headlines). When vaccination rates rise, the price of Gold may fall.
On March 20, 2020, Gold began moving higher off support as fear gripped the markets with the emergence of the coronavirus. Gold was truly a flight to safety for the next four and a half months. During the week of August 3rd, 2020, price printed a new, all-time high of 2075.11, a move of nearly 43%! At the time, central banks were pumping the world with stimulus, as they waited for positive news on the virus. The RSI moved into overbought territory; the Gold pulled back into a consolidation triangle.
Source: Tradingview, Stone X
Trade Gold (XAU/USD) now: Login or Open a new account!
• Open an account in the UK
• Open an account in Australia
• Open an account in Singapore
The price of Gold pulled back to 61.8% Fibonacci retracement level from the March 2020 lows to the August 2020 highs at 1722.68 and has briefly spiked below it 3 times since then. The precious metal has been consolidating in a corrective triangle since the all-time highs and is currently approaching the apex of the triangle.

Source: Tradingview, Stone X
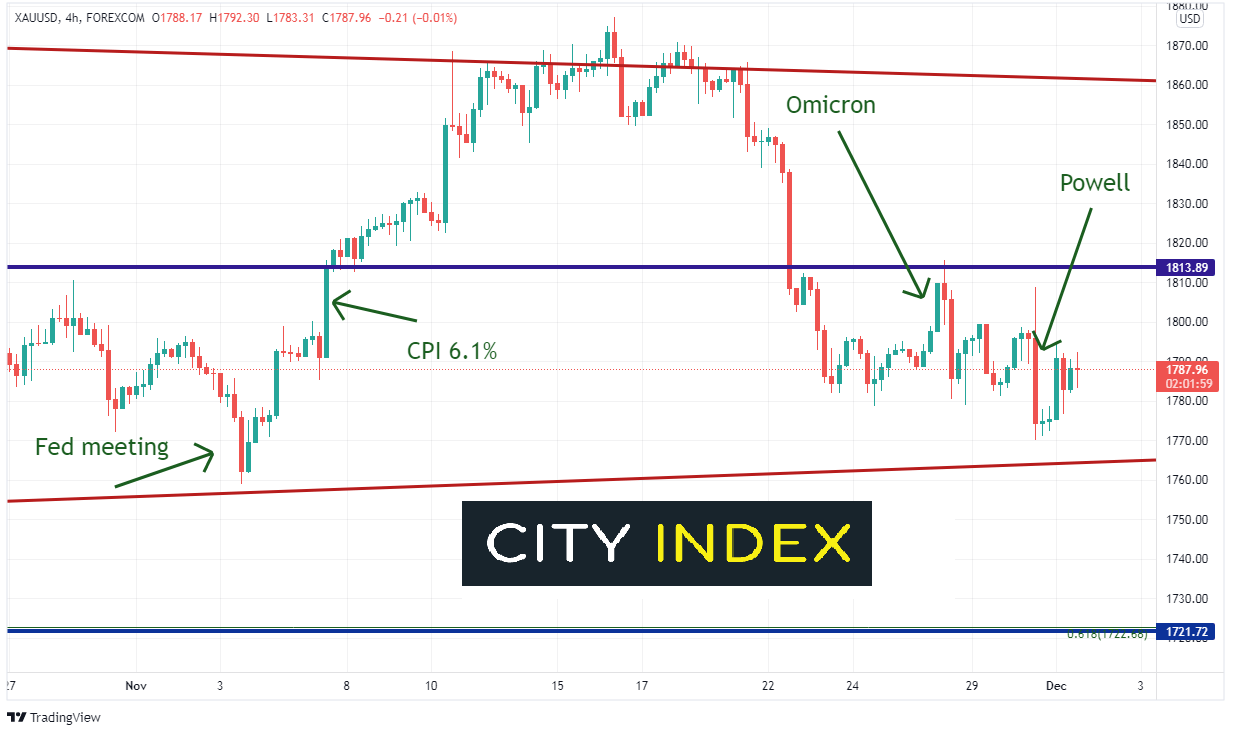
On the 240-minute timeframe, Gold put in a low near the bottom trendline of the long-term triangle (red) near 1758.5, as the Fed announced they would begin tapering its bond buying program at a pace of $15 billion per month. This was not a surprise, as markets had been expecting this result. The move into the low was more of a “Sell the rumor, buy the fact” trade. Gold began moving higher as a result, and shorts were quickly stopped out. A few days later, on November 10th, the US released headline CPI at 6.1% YoY. Gold continued to move higher on expectations of higher inflation AND that the Fed wasn’t doing enough to slow the pace of the increase. Recall that until recently, the Fed had considered inflation to be “transitory”. Gold briefly moved about the upper trendline of the consolidating triangle (red), only to be rejected near 1877.5 .
Source: Tradingview, Stone X
Gold began moving lower again in the triangle, as no less than 4 Fed speaks hinted that the Fed may need to increase the pace of tapering bond purchases. If the pace of bond purchases increase, then inflation would lower. Thus, inflation expectations moved lower, which caused the price of Gold to move lower as well! When the Omicron variant of the coronavirus was first “announced”, Gold did indeed go bid from 1788.7 to resistance at 1815.6. However, sellers entered the market at resistance and pushed price lower as markets worried less and less about inflation. On Tuesday, Powell confirmed what the markets were already thinking: The increase in the pace of bond purchases may be ahead. Powell “retired” the word transitory. Gold initially sold off, however bounced back on a “sell the news, buy the fact” trade.
Where is Gold headed now?
With fears of higher inflation dwindling in the market, the direction of Gold will most likely be dependent on the Omicron variant. If data over the next 2 week shows that the virus will slow growth over the coming months, the price of Gold should increase. This may lead to lower expectations that the Fed will increase the pace of tapering at the next meeting, which would also push the price of Gold higher. However, if Omicron can be contained, the Fed should increase the taper, which would cause Gold to move lower.
Notice that price is approaching the apex of the triangle and consolidating at both the 50- and 200- Day Moving Averages at 1791. Resistance is at the recent highs near 1815.5. A close above would indicate a possible move back toward top trendline of the long-term triangle and recent highs near 1877. Horizontal resistance above there is at 1916.6. Support is at recent lows and the bottom, upward sloping trendline of the triangle near 1770. Below there is the previously mentioned long-term 61.8% Fibonacci retracement and horizontal support at 1721.72, then the triple bottom lows at 1678.9.
Gold has been consolidating towards the apex of a long-term triangle between 1770 and 1877. The next direction in Gold will depend on the Omicron variant and market expectations of how the virus may change the Fed’s thinking at the next meeting on December 15th and 16th.
Learn more about forex trading opportunities.
Related tags:


Open an account in minutes
Experience award-winning platforms with fast and secure execution, and enjoy tight spreads from 0.5 pts on FX and 0.3 pts on indices.
Economic calendar
Web Trader platform
Our sophisticated web-based platform is packed with features.
Related articles
NZD/USD pressure mounts as payrolls looms large
NZD/USD has fallen sharply as Fed rate expectations reset higher, but extreme downside stretch and major support raise the risk of a violent counter-trend rebound.

US Core PCE Preview: Stale or Significant for the Fed
Core PCE inflation takes center stage Wednesday, with traders watching for signs of renewed price pressure and clues on whether the Fed could hike again in October.


Gold Forecast: Are Bears Regaining Control of XAU/USD?
The start of the trading week has not been particularly favorable for gold. This can be seen in recent XAU/USD price action, with the metal falling nearly 4.00% over the last two trading sessions and bringing renewed attention to a bearish bias within the market.

This report is intended for general circulation only. It should not be construed as a recommendation, or an offer (or solicitation of an offer) to buy or sell any financial products. The information provided does not take into account your specific investment objectives, financial situation or particular needs. Before you act on any recommendation that may be contained in this report, independent advice ought to be sought from a financial adviser regarding the suitability of the investment product, taking into account your specific investment objectives, financial situation or particular needs.
StoneX Financial Pte. Ltd., may distribute reports produced by its respective foreign entities or affiliates within the StoneX group of companies or third parties pursuant to an arrangement under Regulation 32C of the Financial Advisers Regulations. Where the report is distributed to a person in Singapore who is not an accredited investor, expert investor or an institutional investor (as defined in the Securities Futures Act), StoneX Financial Pte. Ltd. accepts legal responsibility to such persons for the contents of the report only to the extent required by law. Singapore recipients should contact StoneX Financial Pte. Ltd. at 6826 9988 for matters arising from, or in connection with the report.
In the case of all other recipients of this report, to the extent permitted by applicable laws and regulations neither StoneX Financial Pte. Ltd. nor its associated companies will be responsible or liable for any loss or damage incurred arising out of, or in connection with, any use of the information contained in this report and all such liability is hereby expressly disclaimed. No representation or warranty is made, express or implied, that the content of this report is complete or accurate.
StoneX Financial Pte. Ltd. is not under any obligation to update this report.
Trading CFDs carries a high level of risk that may not be suitable for some investors. Consider your investment objectives, level of experience, financial resources, risk appetite and other relevant circumstances carefully. The possibility exists that you could lose some or all of your investments, including your initial deposits. If in doubt, please seek independent expert advice. Visit www.forex.com/en-sg/terms-and-policies for the complete Risk Disclosure Statement.