





Gold Rally Stalls Below Monthly High: Is a Deeper Pullback Brewing?
Gold may fail to break the prior month’s high for the first time in 2024 — a signal that preceded a two-month retracement last year. With overbought signals flashing on higher timeframes, traders should be on alert for a potential deeper correction.
Share this:

Gold Futures (GC) Technical Analysis
It seems far more likely than not that gold will go on to print new highs this year, given the strength of its bullish trend and supporting fundamentals. However, it appears to be undergoing a much-needed correction — potentially a welcome opportunity for sidelined bulls waiting to reload at more favourable prices.
Gold Futures (GC): Monthly Chart
Gold’s parabolic trend began in March 2024, following a breakout from an inverted head and shoulders (H&S) pattern that reached its projected upside target of ~2800 within seven months. After a two-month retracement, bulls regained control, driving prices as high as 3500.
However, it now seems likely that gold will fail to take out the previous month’s high for the first time this year. With just one week of the month remaining, gold is currently on track to print a spinning top doji, having met resistance around 3400 — just beneath its all-time high (ATH).
The monthly RSI (14) remains extremely overbought, while a bearish divergence has formed in the oversold zone of the RSI (2).
Support has been found around the 23.6% Fibonacci ratio ~3140, though a break beneath it opens up a run for the 38.2% fib level near the 10-month SMA and 2900 handle.
Gold Futures (GC): Weekly and Daily Chart
Time will tell whether the monthly timeframe is in for a deeper pullback. For now, we can hone in on the weekly and daily charts for a potential near-term setup.
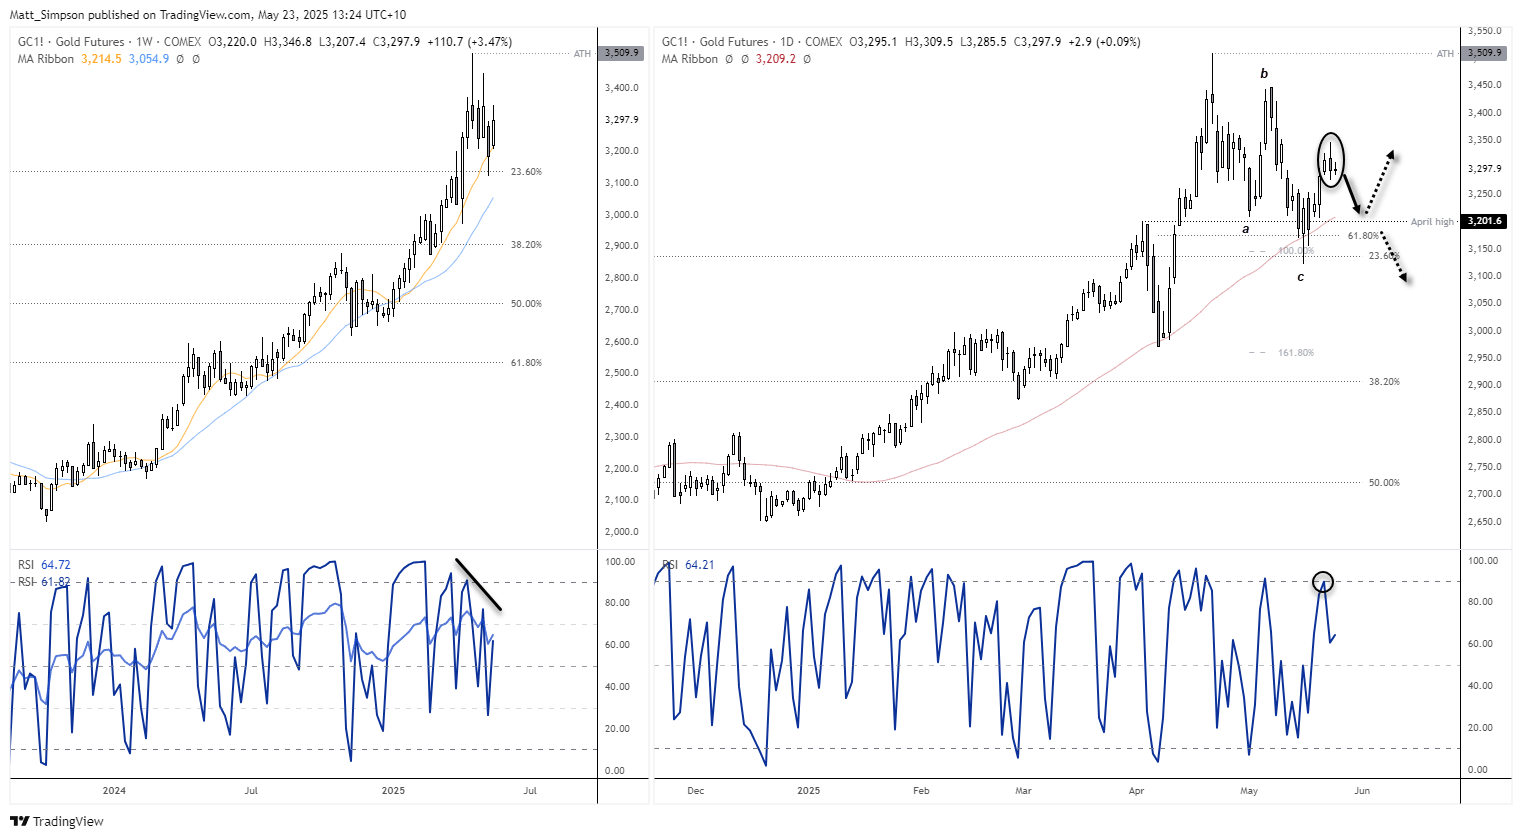
Choppier price action is already apparent on the weekly chart and has been accompanied by a bearish divergence on the RSI (2).
The daily chart shows that gold has completed the ABC correction I suggested earlier in May. The end of wave C found support near the long-term 23.6% Fibonacci retracement and the 100% projection of wave A to B. The recent closing lows also held above a smaller 61.8% Fibonacci level, suggesting that gold may not be ready to break beneath the 3180 level — at least for now.
However, a bearish outside day formed on Thursday, with the RSI (2) rising to 89.7 — nearing the typical overbought threshold of 90. This hints that a pullback toward the 50-day SMA around the 3200 handle could be on the cards in the near term.
If such a pullback occurs, how prices react around the 3180–3200 zone could offer better insight into whether the ABC correction is indeed complete (and a rally to new highs is likely), or if a deeper pullback is still yet to unfold.
-- Written by Matt Simpson
Follow Matt on Twitter @cLeverEdge
How to trade with City Index
You can trade with City Index by following these four easy steps:
- Open an account, or log in if you’re already a customer
• Open an account in the UK
• Open an account in Australia
• Open an account in Singapore
- Search for the market you want to trade in our award-winning platform
- Choose your position and size, and your stop and limit levels
- Place the trade
Related tags:
Latest market news




Open an account in minutes
Experience award-winning platforms with fast and secure execution, and enjoy tight spreads from 0.5 pts on FX and 0.3 pts on indices.
Economic calendar
Web Trader platform
Our sophisticated web-based platform is packed with features.
Related articles
Gold forecast: XAU/USD continues to coil as support holds again
Gold is being pulled in two directions by the same macro force: inflation. Persistent price pressures should, in theory, strengthen demand for the metal as a store of value. But if inflation proves sticky enough to keep central banks hawkish, the resulting rise in real and nominal yields makes gold less attractive at the margin.


Crude Oil Rally Faces Resistance as WTI and Brent Lose Momentum
WTI and Brent crude oil have rallied sharply, but high-volume dojis, RSI divergence and cautious positioning warn of pullback risk.

Gold Update: XAU/USD Remains Directionless Despite Falling Yields
As the trading week continues to unfold, the lack of direction dominating gold price action remains a relevant theme in the short term. In fact, the average move over the last three trading sessions has resulted in a decline of barely 1.0%, highlighting that neither buyers nor sellers have been able to take control in a consistent manner.

This report is intended for general circulation only. It should not be construed as a recommendation, or an offer (or solicitation of an offer) to buy or sell any financial products. The information provided does not take into account your specific investment objectives, financial situation or particular needs. Before you act on any recommendation that may be contained in this report, independent advice ought to be sought from a financial adviser regarding the suitability of the investment product, taking into account your specific investment objectives, financial situation or particular needs.
StoneX Financial Pte. Ltd., may distribute reports produced by its respective foreign entities or affiliates within the StoneX group of companies or third parties pursuant to an arrangement under Regulation 32C of the Financial Advisers Regulations. Where the report is distributed to a person in Singapore who is not an accredited investor, expert investor or an institutional investor (as defined in the Securities Futures Act), StoneX Financial Pte. Ltd. accepts legal responsibility to such persons for the contents of the report only to the extent required by law. Singapore recipients should contact StoneX Financial Pte. Ltd. at 6826 9988 for matters arising from, or in connection with the report.
In the case of all other recipients of this report, to the extent permitted by applicable laws and regulations neither StoneX Financial Pte. Ltd. nor its associated companies will be responsible or liable for any loss or damage incurred arising out of, or in connection with, any use of the information contained in this report and all such liability is hereby expressly disclaimed. No representation or warranty is made, express or implied, that the content of this report is complete or accurate.
StoneX Financial Pte. Ltd. is not under any obligation to update this report.
Trading CFDs carries a high level of risk that may not be suitable for some investors. Consider your investment objectives, level of experience, financial resources, risk appetite and other relevant circumstances carefully. The possibility exists that you could lose some or all of your investments, including your initial deposits. If in doubt, please seek independent expert advice. Visit www.forex.com/en-sg/terms-and-policies for the complete Risk Disclosure Statement.