



Gold, Silver Brace for Big Tech and Fed Collision Course
Gold and silver have tracked risk appetite closely, but major catalysts now loom. With the Fed, mega cap tech earnings and Gulf headlines to navigate, the calm may not last.
Share this:

- Gold, silver tracking stocks, yet both trade heavy
- Tech earnings and Gulf headlines may drive sentiment
- Powell future may matter more than Fed decision
- Pullback in both metals stalls at known fib retracements
Risk appetite driving precious metals
Gold and silver may take their directional cues off risk appetite this week, with sentiment surrounding a packed US earnings calendar potentially as important in the near term as the Fed or developments in the Gulf.
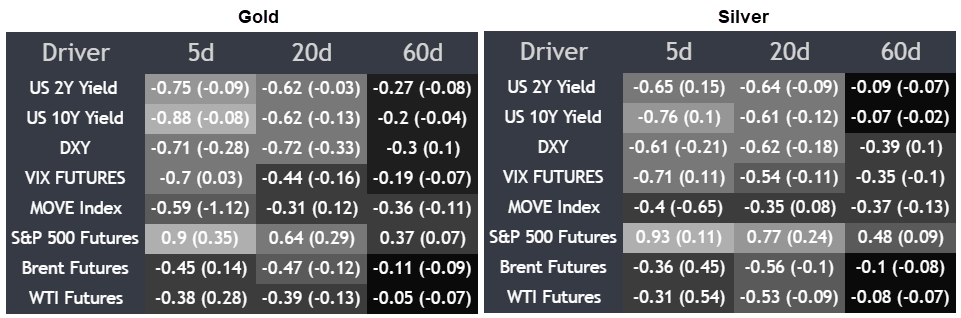
Recent correlations help make that case. Gold’s five-day correlation with S&P 500 futures sits at 0.90, while silver’s is even stronger at 0.93, holding at 0.77 over 20 days. Both metals have also moved inversely to VIX futures and the MOVE Index, suggesting rising volatility in equity and bond markets has recently been a drag rather than a source of support.
Source: TradingView
That points to a backdrop where calmer conditions and bullish price action, especially around US tech, have been benefitting precious metals. That theory faces a major test on Wednesday as earnings from Microsoft, Alphabet, Meta and Amazon collide alongside the Federal Reserve FOMC decision and expected Senate Banking Committee vote on Kevin Warsh’s nomination as Fed chair. Few sessions deliver so many catalysts capable of meaningfully moving yields, the dollar, and broader sentiment at once.
Energy markets remain highly relevant too, with Brent and WTI still influential on the US rates outlook and FX valuations through inflation expectations, terms of trade and energy security channels.
Oil’s influence can be seen in the recent crude correlations. Gold’s relationship with Brent sits at -0.45 over five days and -0.47 over 20 days, while silver shows -0.36 and -0.56. Rather than suggesting Gulf developments are the primary driver of precious metals, it points to a more complex transmission mechanism where moves in crude feed through to rates, the dollar and broader sentiment.
The assessment is that gold and silver are being pulled by several powerful themes at once, with tech earnings optimism, US rates, the dollar and headline-driven energy fluctations competing for control.
Powell future eclipses rates call
With little expected from the Fed in April, and only around 10 basis points of easing priced for the remainder of the year, the hurdle for a meaningful hawkish or dovish surprise looks high given the sheer degree of uncertainty surrounding the outlook. Unless that occurs, Powell’s update on whether he stays on as governor may be the more important event for markets. If he leaves altogether, it would create an earlier governor vacancy, potentially allowing Kevin Warsh to assume Powell's opening and Stephen Miran to remain as a permanent member, shifting the FOMC towards a more dovish composition relative to the current market assessment.
If earnings land well with rates and oil vol remaining contained, both metals may find support, with silver likely the cleaner upside expression given its stronger growth linkage. If crude spikes, volatility jumps, or Powell unsettles markets unexpectedly, the tone could sour quickly.
Gold heavy beneath $4850 resistance
Source: TradingView
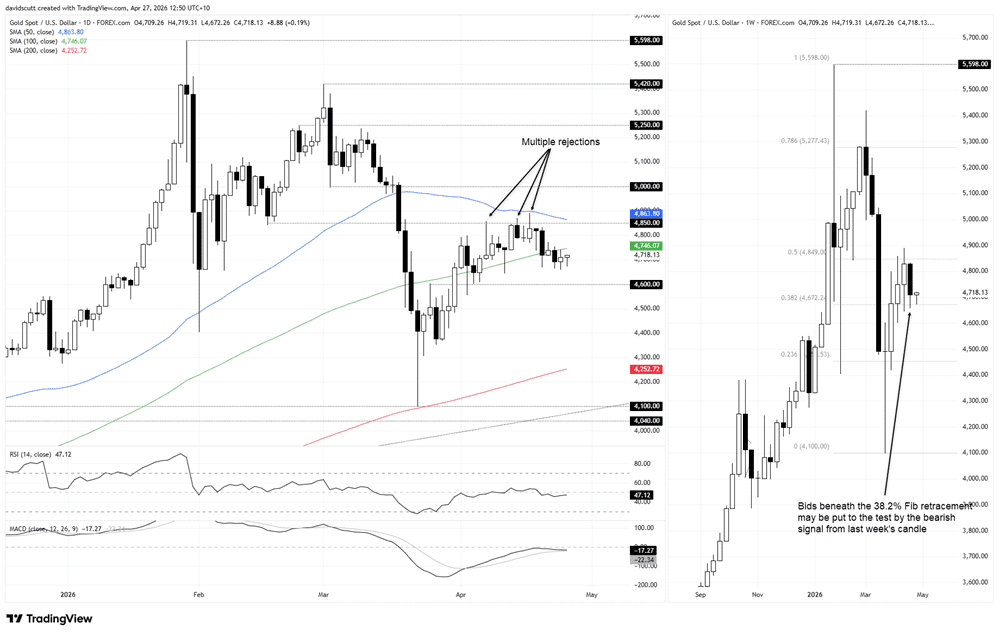
While gold has been tracking US stock futures closely on a day-to-day basis, that strength is not translating into a similarly bullish chart setup. The price looks a touch heavy on the daily timeframe, having been rejected above $4850 resistance several times in April, retracing lower before attracting bids near the 38.2% Fibonacci retracement of the January-April advance at $4672, shown on the weekly chart to the right. That is the immediate downside level in focus, especially after the bearish engulfing candle that printed last week.
Despite that bearish signal, losses in gold stalled at the 38.2% retracement earlier today before reversing higher, helped by another positive headline relating to the potential reopening of the Strait of Hormuz, offsetting negative developments over the weekend. Beneath that level, support to watch includes $4600, the 23.6% Fibonacci retracement of the January-April move, along with the 200-day moving average at $4252.
Follow-through selling after last week's engulfing candle would strengthen conviction those levels may be revisited, especially given how poorly gold traded above $4850 in recent weeks. That remains the key hurdle bulls need to clear before thinking about higher levels and a run back towards the January record high.
Like the rangy price action, the oscillators on the daily are largely neutral. RSI (14) sits just beneath 50, while MACD has moved towards the signal line in negative territory but has yet to cross. Traders should therefore keep an open mind when assessing both bullish and bearish setups.
Silver probes Fib zone
Source: TradingView
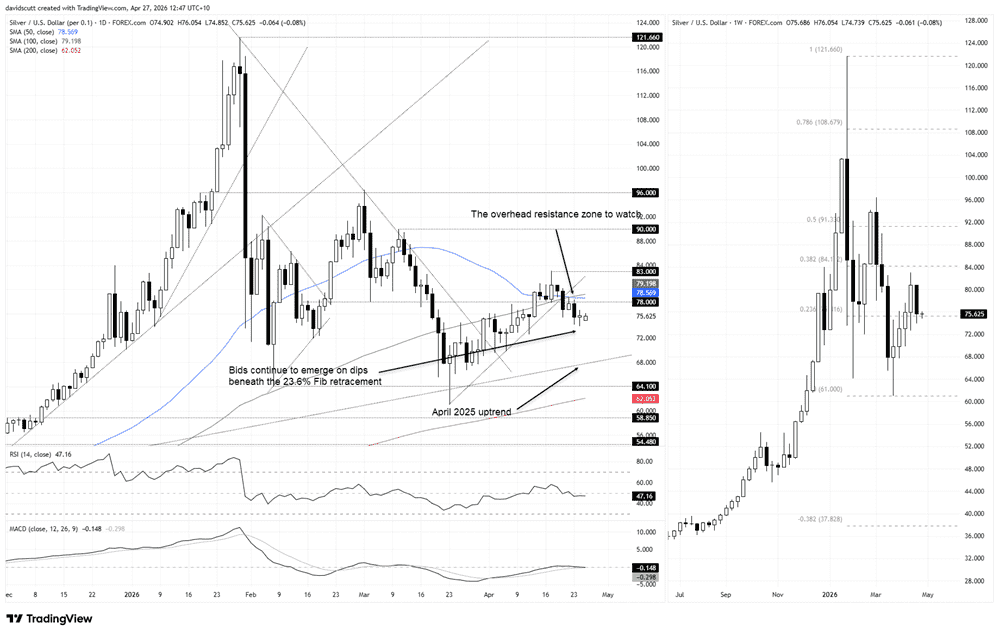
It is a very similar setup for silver, with the modest pullback over the past week stalling at the 23.6% Fibonacci retracement of the January-March bear move at $75.16, raising questions over the strength of the signal from last week's engulfing candle. We have now seen three consecutive downside probes of that level on the daily chart to the left, making it the immediate downside area to watch.
While the price action suggests bulls are lurking beneath the level, the moves over the past week have not been especially convincing as to whether that support can hold. The price has broken beneath the March uptrend, horizontal support at $78, along with the 50 and 100-day moving averages. Those three now pose a decent hurdle for bulls to overcome, with a sustained push back above them improving the prospects for a retest of the April high at $83.
But if the bearish retracement from last week resumes, there is not a lot of visible support other than $72 between where the price now trades and a retest of the August 2025 uptrend, located around $68 today. The oscillators are entirely neutral in their messaging on the daily timeframe, placing the emphasis firmly on price action rather than maintaining any specific directional bias.
Latest market news




Open an account in minutes
Experience award-winning platforms with fast and secure execution, and enjoy tight spreads from 0.5 pts on FX and 0.3 pts on indices.
Economic calendar
Web Trader platform
Our sophisticated web-based platform is packed with features.
Related articles
Gold Forecast: Are Bears Regaining Control of XAU/USD?
The start of the trading week has not been particularly favorable for gold. This can be seen in recent XAU/USD price action, with the metal falling nearly 4.00% over the last two trading sessions and bringing renewed attention to a bearish bias within the market.
Australian Dollar Forecast: AUD/USD Four-Week Slide Nears Critical Uptrend Support 9 29 2026
Aussie momentum has deteriorated sharply into quarter-end, with inflation, Core PCE and NFP on tap as AUD/USD closes in on a pivotal technical threshold.

AUD/USD outlook: Aussie slips despite hawkish RBA ahead of key data
The AUD/USD was unable to benefit from the Reserve Bank of Australia’s 25-basis-point rate hike overnight. The RBA lifted the cash rate to 4.60%, in line with expectations. However, the Australian dollar weakened following the decision, with much of the Bank’s hawkish stance seemingly priced in ahead of the announcement. The US dollar has also remained largely supported following the recent turmoil in the bond markets.

This report is intended for general circulation only. It should not be construed as a recommendation, or an offer (or solicitation of an offer) to buy or sell any financial products. The information provided does not take into account your specific investment objectives, financial situation or particular needs. Before you act on any recommendation that may be contained in this report, independent advice ought to be sought from a financial adviser regarding the suitability of the investment product, taking into account your specific investment objectives, financial situation or particular needs.
StoneX Financial Pte. Ltd., may distribute reports produced by its respective foreign entities or affiliates within the StoneX group of companies or third parties pursuant to an arrangement under Regulation 32C of the Financial Advisers Regulations. Where the report is distributed to a person in Singapore who is not an accredited investor, expert investor or an institutional investor (as defined in the Securities Futures Act), StoneX Financial Pte. Ltd. accepts legal responsibility to such persons for the contents of the report only to the extent required by law. Singapore recipients should contact StoneX Financial Pte. Ltd. at 6826 9988 for matters arising from, or in connection with the report.
In the case of all other recipients of this report, to the extent permitted by applicable laws and regulations neither StoneX Financial Pte. Ltd. nor its associated companies will be responsible or liable for any loss or damage incurred arising out of, or in connection with, any use of the information contained in this report and all such liability is hereby expressly disclaimed. No representation or warranty is made, express or implied, that the content of this report is complete or accurate.
StoneX Financial Pte. Ltd. is not under any obligation to update this report.
Trading CFDs carries a high level of risk that may not be suitable for some investors. Consider your investment objectives, level of experience, financial resources, risk appetite and other relevant circumstances carefully. The possibility exists that you could lose some or all of your investments, including your initial deposits. If in doubt, please seek independent expert advice. Visit www.forex.com/en-sg/terms-and-policies for the complete Risk Disclosure Statement.