



Index in Focus: SPX 500
The FOMC is expected to announce that they will begin tapering their quantitative easing program. What does that means for the S&P 500?
Share this:

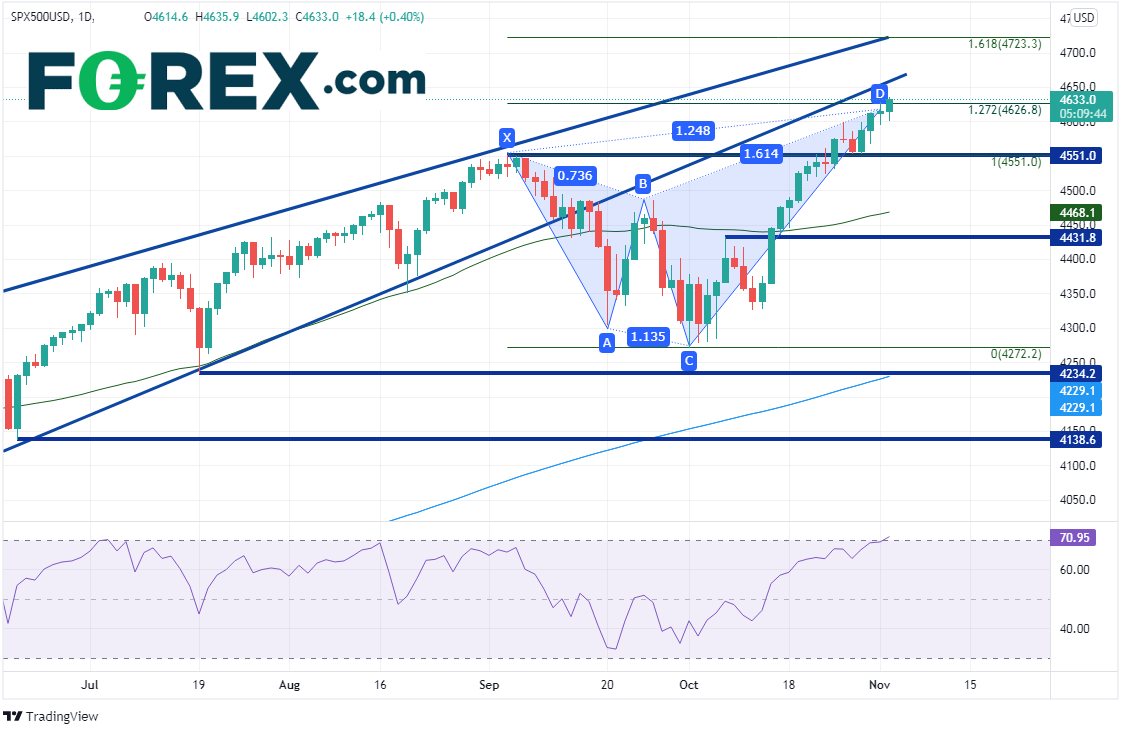
It’s the day before the FOMC is expected to announce that they will begin tapering their quantitative easing program. As discussed in detail in our FOMC Preview, the Fed is currently purchasing $80 billion in Treasuries per month and $40 billion in MBS per month. One suggested pace of the tapering is for $10 billion a month in Treasuries and $5 billion a month in MBS. This would be consistent with Powell’s previous comments that tapering would be finished by mid-2022. The S&P 500 made is at all-time highs near 4635, just above the 127.2% Fibonacci extension of the move from the highs of September 3rd to the lows of October 1st. But will it continue after the FOMC announcement?
Source: Tradingview, Stone X
Trade SPX 500 now: Login or open a new account!
More Hawkish statement
If the Fed is more hawkish than expected (i.e. a faster tapering pace or any mention of an interest rate hike timeframe), the S&P 500 is likely to pull back. First support is at the breakout level of the September 3rd highs at 4551. Below there is the 50 Day Moving Average at 4467.9, horizontal support at 4431.8, and the October 1st lows at 4272.2. Note that the RSI is moving into overbought territory on the eve of the FOMC meeting, an indication price may be ready for a pullback. In addition, on the daily timeframe, price has formed a bearish shark harmonic pattern, another indication price may be ready to move lower.
More Dovish statement
If the Fed is more dovish than expected (i.e. taper will happen soon, but no mention of the pace) , the S&P 500 may take off higher. First resistance is at the bottom trendline of the long-term upward sloping wedge near 4660. Above there is a confluence of resistance at the top trendline of the same wedge at the 161.8% Fibonacci extension of the move from the September 3rd highs to the October 1st lows.
Everything you need to know about the Federal Reserve
“As expected” statement
If the Fed is neutral (i.e. taper announced, slow pace, tapering will end in mid-2022), stocks may continue bid. With the S&P 500 on its highs, an “as expected” statement would give stocks no reason to pause.
Don’t forget that Friday is Non-Farm Payrolls for October. The Fed doesn’t meet again until December 15th, at which time they will release a new Summary of Economic Projections. Therefore, they will have 2 more months of jobs data before their next meeting. If employment (or inflation) moves lower before their next meeting, there is always a chance the Fed puts the brakes on the tapering, which could send stock indices higher once again!
Learn more about index trading opportunities.
It’s the day before the FOMC is expected to announce that they will begin tapering their quantitative easing program. As discussed in detail in our FOMC Preview, the Fed is currently purchasing $80 billion in Treasuries per month and $40 billion in MBS per month. One suggested pace of the tapering is for $10 billion a month in Treasuries and $5 billion a month in MBS. This would be consistent with Powell’s previous comments that tapering would be finished by mid-2022. The S&P 500 made is at all-time highs near 4635, just above the 127.2% Fibonacci extension of the move from the highs of September 3rd to the lows of October 1st. But will it continue after the FOMC announcement?

Source: Tradingview, Stone X
Trade SPX 500 now: Login or Open a new account!
• Open an account in the UK
• Open an account in Australia
• Open an account in Singapore
More Hawkish statement
If the Fed is more hawkish than expected (i.e. a faster tapering pace or any mention of an interest rate hike timeframe), the S&P 500 is likely to pull back. First support is at the breakout level of the September 3rd highs at 4551. Below there is the 50 Day Moving Average at 4467.9, horizontal support at 4431.8, and the October 1st lows at 4272.2. Note that the RSI is moving into overbought territory on the eve of the FOMC meeting, an indication price may be ready for a pullback. In addition, on the daily timeframe, price has formed a bearish shark harmonic pattern, another indication price may be ready to move lower.
More Dovish statement
If the Fed is more dovish than expected (i.e. taper will happen soon, but no mention of the pace) , the S&P 500 may take off higher. First resistance is at the bottom trendline of the long-term upward sloping wedge near 4660. Above there is a confluence of resistance at the top trendline of the same wedge at the 161.8% Fibonacci extension of the move from the September 3rd highs to the October 1st lows.
Everything you need to know about the Federal Reserve
“As expected” statement
If the Fed is neutral (i.e. taper announced, slow pace, tapering will end in mid-2022), stocks may continue bid. With the S&P 500 on its highs, an “as expected” statement would give stocks no reason to pause.
Don’t forget that Friday is Non-Farm Payrolls for October. The Fed doesn’t meet again until December 15th, at which time they will release a new Summary of Economic Projections. Therefore, they will have 2 more months of jobs data before their next meeting. If employment (or inflation) moves lower before their next meeting, there is always a chance the Fed puts the brakes on the tapering, which could send stock indices higher once again!
Learn more about index trading opportunities.
Related tags:



Open an account in minutes
Experience award-winning platforms with fast and secure execution, and enjoy tight spreads from 0.5 pts on FX and 0.3 pts on indices.
Economic calendar
Web Trader platform
Our sophisticated web-based platform is packed with features.
Related articles

USD/JPY forecast: US dollar strengths amid hawkish Fed despite recent oil weakness
The US dollar has extended its gains this morning, even if oil prices finished lower for the fifth consecutive day yesterday. Oil prices have bounced back in this first half of today’s session, causing a bit of pressure on currencies that rely on energy imports such as the euro, pound, Swiss franc, and Japanese yen. But it was the dollar that was exerting the most pressure, amid hawkish FedSpeak. Meanwhile, European indices and precious metals were also under a bit of pressure amid the strength of the dollar.


USD/JPY and USD/CHF Could Diverge as CHF/JPY Approaches Resistance
USD/JPY and USD/CHF retain bullish structures, but CHF/JPY resistance could expose a divergence between the two US dollar pairs.

EUR/AUD, GBP/AUD Outlook: Rates, risk and metals reinforce bearish technical case
EUR/AUD and GBP/AUD are coiling near support, with recent correlations suggesting the Aussie’s strength is being driven more by rates, risk and metals than energy.

This report is intended for general circulation only. It should not be construed as a recommendation, or an offer (or solicitation of an offer) to buy or sell any financial products. The information provided does not take into account your specific investment objectives, financial situation or particular needs. Before you act on any recommendation that may be contained in this report, independent advice ought to be sought from a financial adviser regarding the suitability of the investment product, taking into account your specific investment objectives, financial situation or particular needs.
StoneX Financial Pte. Ltd., may distribute reports produced by its respective foreign entities or affiliates within the StoneX group of companies or third parties pursuant to an arrangement under Regulation 32C of the Financial Advisers Regulations. Where the report is distributed to a person in Singapore who is not an accredited investor, expert investor or an institutional investor (as defined in the Securities Futures Act), StoneX Financial Pte. Ltd. accepts legal responsibility to such persons for the contents of the report only to the extent required by law. Singapore recipients should contact StoneX Financial Pte. Ltd. at 6826 9988 for matters arising from, or in connection with the report.
In the case of all other recipients of this report, to the extent permitted by applicable laws and regulations neither StoneX Financial Pte. Ltd. nor its associated companies will be responsible or liable for any loss or damage incurred arising out of, or in connection with, any use of the information contained in this report and all such liability is hereby expressly disclaimed. No representation or warranty is made, express or implied, that the content of this report is complete or accurate.
StoneX Financial Pte. Ltd. is not under any obligation to update this report.
Trading CFDs carries a high level of risk that may not be suitable for some investors. Consider your investment objectives, level of experience, financial resources, risk appetite and other relevant circumstances carefully. The possibility exists that you could lose some or all of your investments, including your initial deposits. If in doubt, please seek independent expert advice. Visit www.forex.com/en-sg/terms-and-policies for the complete Risk Disclosure Statement.