



Is Gold’s shine about to fade?
With Gold sitting at resistance, the RSI diverging with price, and managed funds extremely bullish, there may be a pullback
Share this:

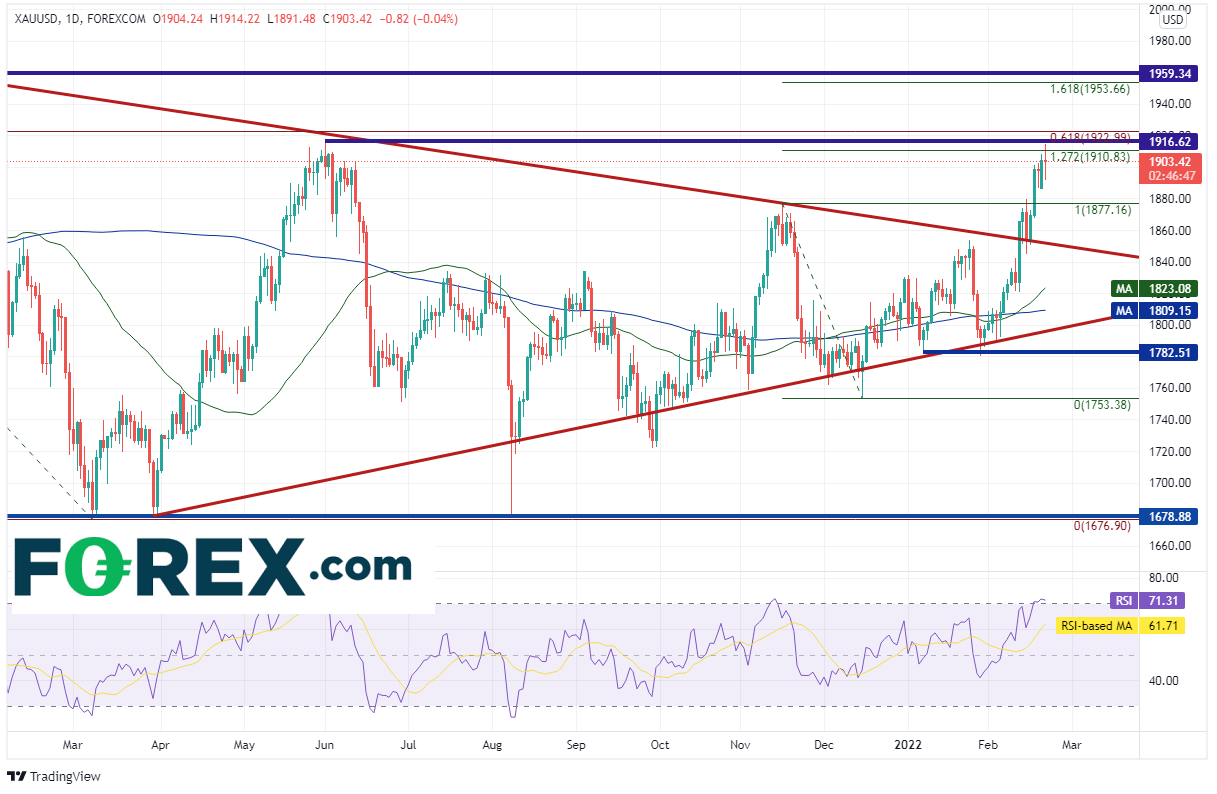
As Russia was building troops along the Ukraine border, Gold (XAU/USD) was nearing the apex of a long-term symmetrical triangle. Finally, on February 11th, as the “flight to safety” trade began in earnest, Gold broke out above the top, downward sloping trendline of the triangle. As we wrote about last week, price moved higher towards a large resistance area between 1910 and 1923. The resistance in this area is made up of the following;
- The 127.2% Fibonacci extension from the highs of November 16th, 2021 to the lows of December 15th, 2021
- Horizontal resistance from the highs of June 1st, 2021
- The 61.8% Fibonacci retracement from the all-time highs on August 7th, 2020 to the lows of March 8th, 2021.
Source: Tradingview, Stone X
Not only was the move to this area precipitated by the fear of an invasion, but it was also due to rising inflation and sentiment. In particular, the most recent COT report which showed that managed funds most bullish on gold in 3 months. Today, the price of Gold traded as high as 1914.22 and was rejected. Does this mean that the Gold prices will move lower?
Source: Tradingview, Stone X
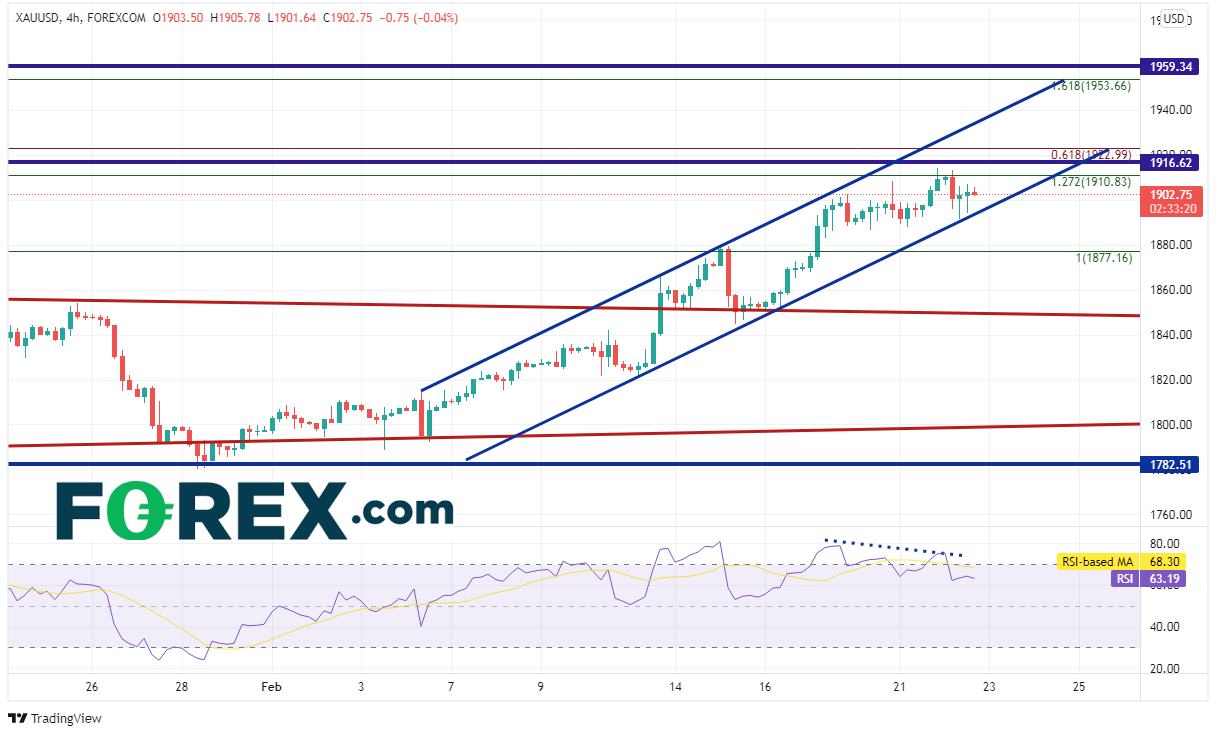
Notice on the 240-minute timeframe that the RSI is diverging with price. If price does move lower, first support is at today’s lows near 1891.48 and then horizontal support near 1877.16. The top, downward sloping trendline of the long-term trendline (red) is the next support level near 1850. However, if price is able trade above 1923, the top trendline of the channel is the first level of resistance at 1934. Above there is a confluence of resistance at the 161.8% Fibonacci extension from the November 16th, 2021 highs to the December 15th, 2021 lows and horizontal resistance from the January 6th, 2021 highs between 1953.66 and 1959.34. The psychological round number resistance is just above there at 2000.
Russia has moved into Donetsk and Luhansk and some believe Putin is set to move further into Ukraine. Will that draw more ire from the West which will lead to war? That has yet to be determined. However, right now, with Gold sitting at a confluence of resistance, the RSI diverging with price, and managed funds extremely bullish the yellow metal, there may be a pullback before it resumes higher.
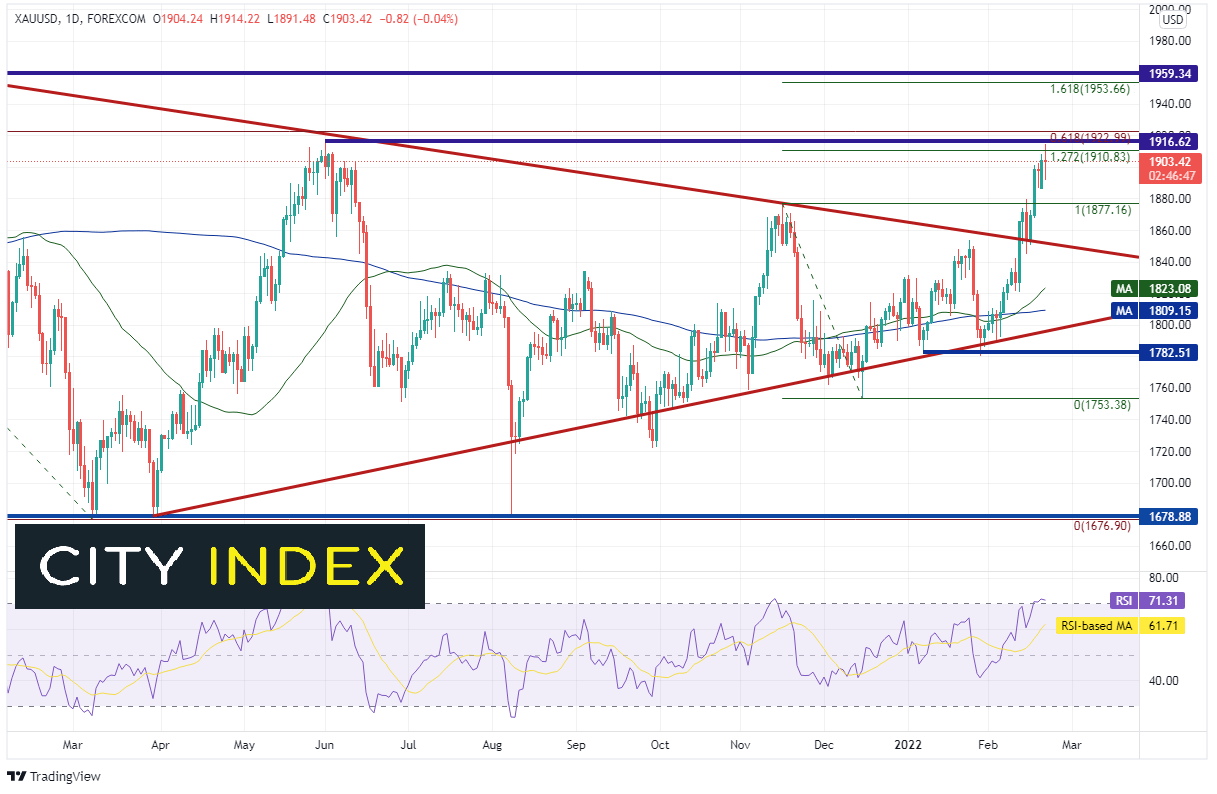
As Russia was building troops along the Ukraine border, Gold (XAU/USD) was nearing the apex of a long-term symmetrical triangle. Finally, on February 11th, as the “flight to safety” trade began in earnest, Gold broke out above the top, downward sloping trendline of the triangle. As we wrote about last week, price moved higher towards a large resistance area between 1910 and 1923. The resistance in this area is made up of the following;
- The 127.2% Fibonacci extension from the highs of November 16th, 2021 to the lows of December 15th, 2021
- Horizontal resistance from the highs of June 1st, 2021
- The 61.8% Fibonacci retracement from the all-time highs on August 7th, 2020 to the lows of March 8th, 2021.
Source: Tradingview, Stone X
Not only was the move to this area precipitated by the fear of an invasion, but it was also due to rising inflation and sentiment. In particular, the most recent COT report which showed that managed funds most bullish on gold in 3 months. Today, the price of Gold traded as high as 1914.22 and was rejected. Does this mean that the Gold prices will move lower?

Source: Tradingview, Stone X
Trade Gold (XAU/USD) now: Login or Open a new account!
• Open an account in the UK
• Open an account in Australia
• Open an account in Singapore
Notice on the 240-minute timeframe that the RSI is diverging with price. If price does move lower, first support is at today’s lows near 1891.48 and then horizontal support near 1877.16. The top, downward sloping trendline of the long-term trendline (red) is the next support level near 1850. However, if price is able trade above 1923, the top trendline of the channel is the first level of resistance at 1934. Above there is a confluence of resistance at the 161.8% Fibonacci extension from the November 16th, 2021 highs to the December 15th, 2021 lows and horizontal resistance from the January 6th, 2021 highs between 1953.66 and 1959.34. The psychological round number resistance is just above there at 2000.
Russia has moved into Donetsk and Luhansk and some believe Putin is set to move further into Ukraine. Will that draw more ire from the West which will lead to war? That has yet to be determined. However, right now, with Gold sitting at a confluence of resistance, the RSI diverging with price, and managed funds extremely bullish the yellow metal, there may be a pullback before it resumes higher.
Learn more about metals trading opportunities.
Related tags:


Open an account in minutes
Experience award-winning platforms with fast and secure execution, and enjoy tight spreads from 0.5 pts on FX and 0.3 pts on indices.
Economic calendar
Web Trader platform
Our sophisticated web-based platform is packed with features.
Related articles
Canadian Dollar Technical Outlook: USD/CAD Seven-Day Rally Tests Major Resistance 9 29 2026
USD/CAD is pressing into a major technical barrier after an extended advance, raising the risk for price inflection as momentum stretches.

RBA delivers 25bp hike, Bullock now the main event
The RBA delivered the expected 25bp hike, but Bullock’s press conference now looms as the bigger volatility risk for AUD/USD and the ASX 200.


Gold outlook: XAU/USD hammered, stretched and vulnerable to a sharp rebound
Gold is getting hammered for solid fundamental reasons, but history suggests extreme four-hourly oversold conditions can produce violent countertrend rallies.
This report is intended for general circulation only. It should not be construed as a recommendation, or an offer (or solicitation of an offer) to buy or sell any financial products. The information provided does not take into account your specific investment objectives, financial situation or particular needs. Before you act on any recommendation that may be contained in this report, independent advice ought to be sought from a financial adviser regarding the suitability of the investment product, taking into account your specific investment objectives, financial situation or particular needs.
StoneX Financial Pte. Ltd., may distribute reports produced by its respective foreign entities or affiliates within the StoneX group of companies or third parties pursuant to an arrangement under Regulation 32C of the Financial Advisers Regulations. Where the report is distributed to a person in Singapore who is not an accredited investor, expert investor or an institutional investor (as defined in the Securities Futures Act), StoneX Financial Pte. Ltd. accepts legal responsibility to such persons for the contents of the report only to the extent required by law. Singapore recipients should contact StoneX Financial Pte. Ltd. at 6826 9988 for matters arising from, or in connection with the report.
In the case of all other recipients of this report, to the extent permitted by applicable laws and regulations neither StoneX Financial Pte. Ltd. nor its associated companies will be responsible or liable for any loss or damage incurred arising out of, or in connection with, any use of the information contained in this report and all such liability is hereby expressly disclaimed. No representation or warranty is made, express or implied, that the content of this report is complete or accurate.
StoneX Financial Pte. Ltd. is not under any obligation to update this report.
Trading CFDs carries a high level of risk that may not be suitable for some investors. Consider your investment objectives, level of experience, financial resources, risk appetite and other relevant circumstances carefully. The possibility exists that you could lose some or all of your investments, including your initial deposits. If in doubt, please seek independent expert advice. Visit www.forex.com/en-sg/terms-and-policies for the complete Risk Disclosure Statement.