





Japanese Yen Technical Analysis: USD/JPY, EUR/JPY, GBP/JPY
USD/JPY has seen price action narrow into a triangle and the CPI report will probably have a big impact on the major pair. EUR/JPY and GBP/JPY are both highlighting bullish breakout potential.
Share this:

USD/JPY, U.S. Dollar Talking Points:
- USD/JPY remains a big driver behind the U.S. Dollar as we’ve seen so far through 2025 trade.
- Bears had an open door to run with a break over the past two weeks but they were continually caught at 142.50 support, with another higher-low showing around the big figure last Wednesday and Thursday.
- Bulls haven’t exactly had a free run either, however, as the 145 level held the highs into last week’s close and brought a pullback to 144 in early-week trade. That zone, along with a Fibonacci retracement at 144.86, is now confluent with trendline resistance making up the symmetrical triangle.
USD/JPY continues to digest and at this point the pair remains in a symmetrical triangle formation. Normally, such digestion comes with no discernible bias, but given the prior trend, this could be qualified as a bear pennant formation. This would be the opposite of the bull pennant that showed in gold in Q4 of last year, which then led to topside breakouts in the metal in 2025.
This is more of a leaning than a hard set and fast rule, however, because all that we know for a fact is that price has been digesting with both higher-lows and lower-highs, and that doesn’t necessarily have to continue in the direction of the prior trend.
USD/JPY Daily Chart
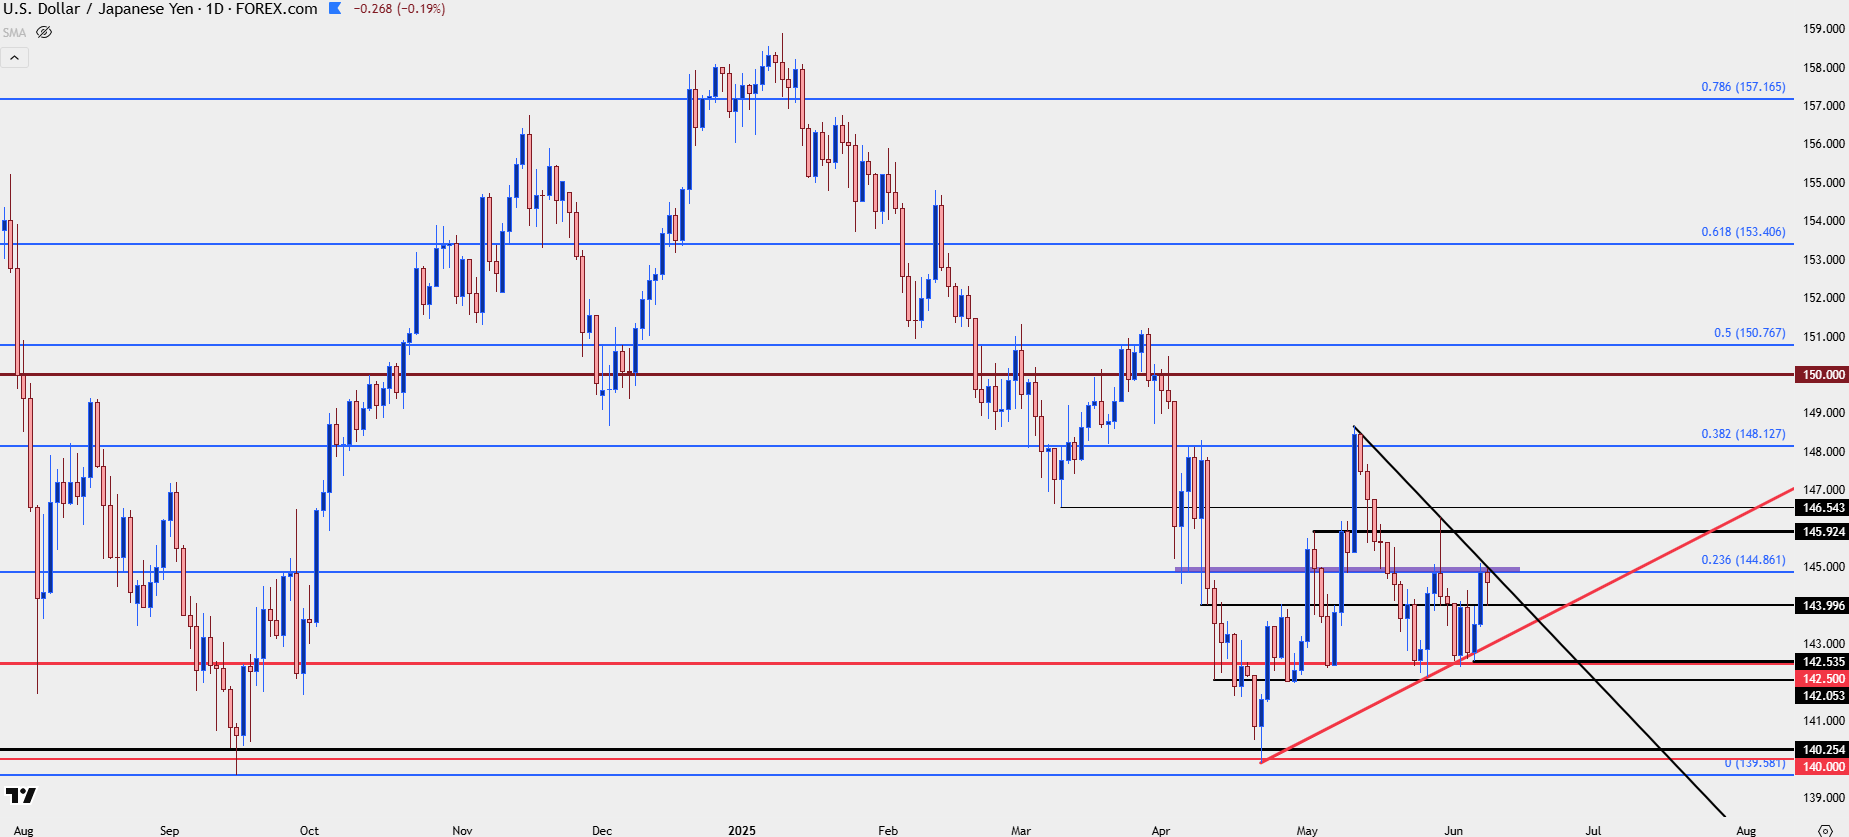 Chart prepared by James Stanley; data derived from Tradingview
On the bullish side, it was the 140 level that held the lows when tested in April, and so far that’s kept bears at bay, helping to build continually higher-highs and higher-lows, such as we saw last week with the 142.50 hold on Monday followed by a higher-low at 142.535 on Wednesday/Thursday.
A strong response to that sent price directly to 145.00, which has so far held as resistance, but even the response to that has seen a higher-low hold at 144.00. From shorter-term perspectives a bullish bias can be justified; and as I’ve been saying, I think this has a large drive with bigger picture USD themes, placing even more importance on the Wednesday US CPI report.
USD/JPY Four-Hour Chart

Chart prepared by James Stanley; data derived from Tradingview
EUR/JPY
EUR/JPY is on the verge of breakout which further illustrates that short-term theme of Yen-weakness looked at above on shorter-term USD/JPY charts. If we do end up seeing Yen-strength, I’m of the mind that EUR/JPY could be of attraction.
But given the current technical backdrop that would be difficult to justify at the moment as price has shown short-term higher-highs and lows and we have the building breakout backdrop on the daily chart below, which has tonalities of an inverse head and shoulders formation with a neckline at 165.21.
EUR/JPY Daily Chart
 Chart prepared by James Stanley; data derived from Tradingview
EUR/JPY Shorter-Term
To get bearish on EUR/JPY, the near-term bullish structure would need to see some damage. Until then, I would want to default to the bullish sequence that’s showing.
I have key resistance at 165.21, which has an open door to breakout potential if we do see buyers press. But it’s the support structure that’s of more interest as support from prior resistance at 164.64 is followed by 164.26.
As shown in the video, I’d need 164.26 to come into play, after which a bounce up to and a show of resistance at 164.64 opens the door for a lower-high and short-term bearish continuation.
EUR/JPY Four-Hour Chart
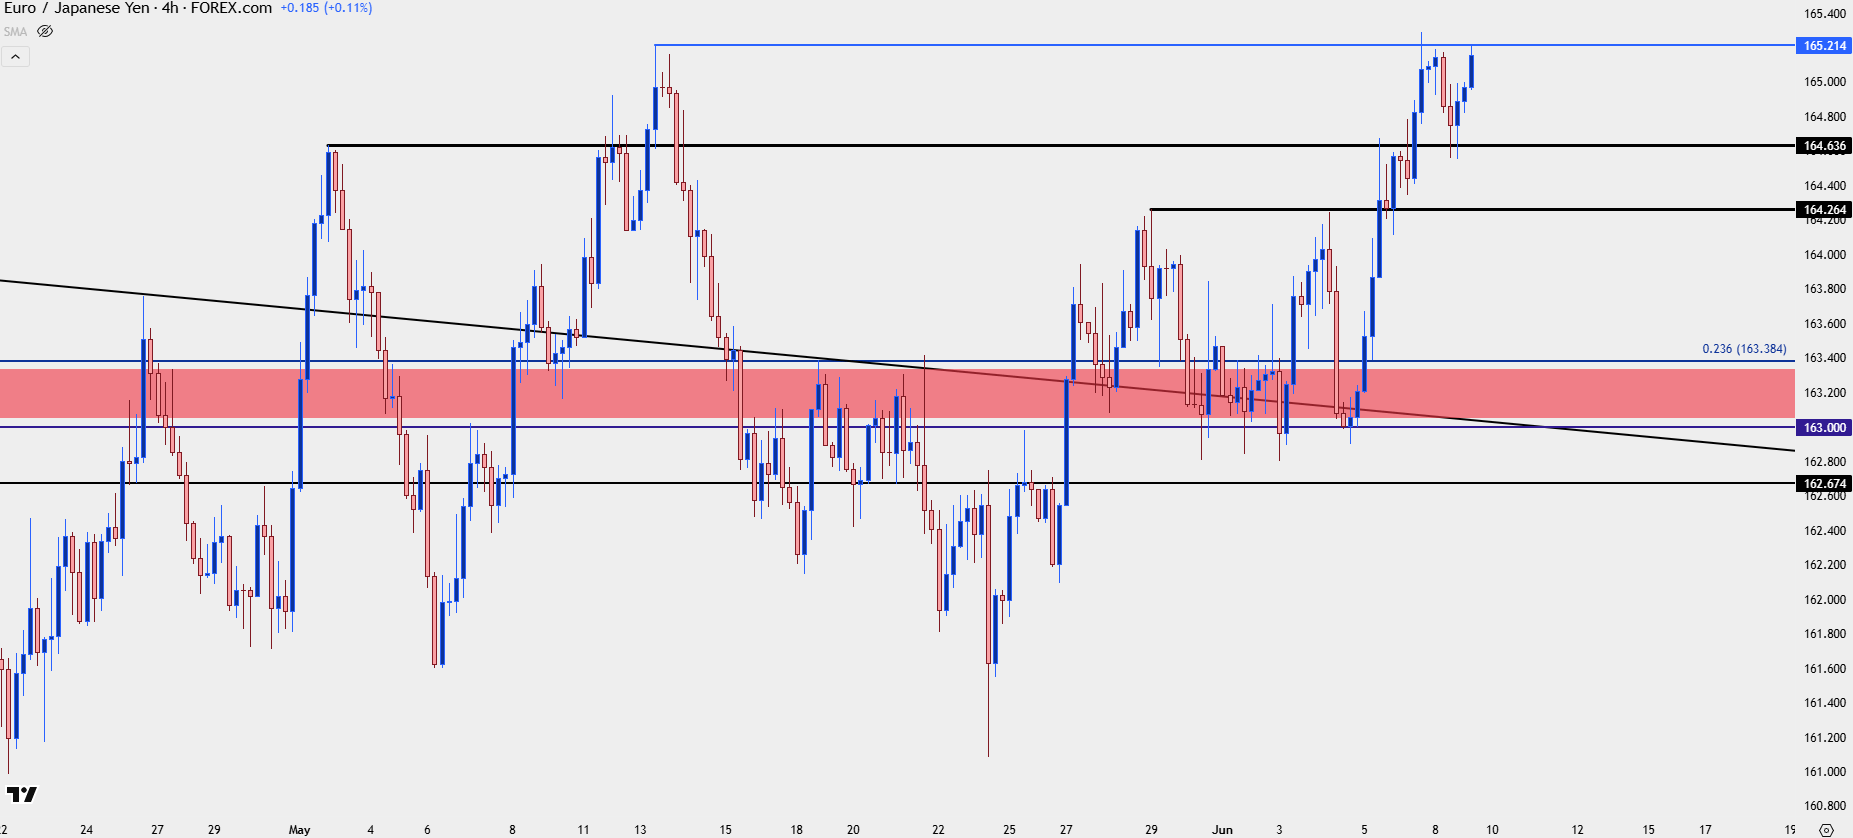 Chart prepared by James Stanley; data derived from Tradingview
GBP/JPY
For Yen-weakness, my preference is still with GBP/JPY. The pair similarly holds breakout potential like the above setup in EUR/JPY. From the weekly chart below, we can see that price is in a familiar area that’s held the highs for three of the past four weeks. Bulls are already up there again and if we do see Yen-weakness take over, I like upside potential in GBP/JPY more than either of the above markets of USD/JPY or EUR/JPY.
GBP/JPY Weekly Chart
 Chart prepared by James Stanley; data derived from Tradingview
GBP/JPY Shorter-Term
From the daily chart we can see the struggle that bulls have had gaining acceptance above the 195.00 handle, which was resistance both on Wednesday and Thursday of last week. And so far for today, its an indecisive doji near the highs, which sets up that 195.00 level as deeper support potential. I think what’s notable here is the persistence that bulls have continued to show as given the higher-lows over the past four weeks, as that resistance in the 196.19-196.32 area has held the highs.
This takes on the form of an ascending triangle, which is often approached with aim of bullish breakouts.
And if bulls can force the break, the next major area of resistance potential on the chart is the 198.08 level, which is the top of the long-term gap in GBP/JPY.
GBP/JPY Daily Price Chart
 Chart prepared by James Stanley; data derived from Tradingview
--- written by James Stanley, Senior Strategist
USD/JPY, U.S. Dollar Talking Points:
- USD/JPY remains a big driver behind the U.S. Dollar as we’ve seen so far through 2025 trade.
- Bears had an open door to run with a break over the past two weeks but they were continually caught at 142.50 support, with another higher-low showing around the big figure last Wednesday and Thursday.
- Bulls haven’t exactly had a free run either, however, as the 145 level held the highs into last week’s close and brought a pullback to 144 in early-week trade. That zone, along with a Fibonacci retracement at 144.86, is now confluent with trendline resistance making up the symmetrical triangle.
USD/JPY continues to digest and at this point the pair remains in a symmetrical triangle formation. Normally, such digestion comes with no discernible bias, but given the prior trend, this could be qualified as a bear pennant formation. This would be the opposite of the bull pennant that showed in gold in Q4 of last year, which then led to topside breakouts in the metal in 2025.
This is more of a leaning than a hard set and fast rule, however, because all that we know for a fact is that price has been digesting with both higher-lows and lower-highs, and that doesn’t necessarily have to continue in the direction of the prior trend.
USD/JPY Daily Chart
Chart prepared by James Stanley; data derived from Tradingview
On the bullish side, it was the 140 level that held the lows when tested in April, and so far that’s kept bears at bay, helping to build continually higher-highs and higher-lows, such as we saw last week with the 142.50 hold on Monday followed by a higher-low at 142.535 on Wednesday/Thursday.
A strong response to that sent price directly to 145.00, which has so far held as resistance, but even the response to that has seen a higher-low hold at 144.00. From shorter-term perspectives a bullish bias can be justified; and as I’ve been saying, I think this has a large drive with bigger picture USD themes, placing even more importance on the Wednesday US CPI report.
USD/JPY Four-Hour Chart
Chart prepared by James Stanley; data derived from Tradingview
EUR/JPY
EUR/JPY is on the verge of breakout which further illustrates that short-term theme of Yen-weakness looked at above on shorter-term USD/JPY charts. If we do end up seeing Yen-strength, I’m of the mind that EUR/JPY could be of attraction.
But given the current technical backdrop that would be difficult to justify at the moment as price has shown short-term higher-highs and lows and we have the building breakout backdrop on the daily chart below, which has tonalities of an inverse head and shoulders formation with a neckline at 165.21.
EUR/JPY Daily Chart
Chart prepared by James Stanley; data derived from Tradingview
EUR/JPY Shorter-Term
To get bearish on EUR/JPY, the near-term bullish structure would need to see some damage. Until then, I would want to default to the bullish sequence that’s showing.
I have key resistance at 165.21, which has an open door to breakout potential if we do see buyers press. But it’s the support structure that’s of more interest as support from prior resistance at 164.64 is followed by 164.26.
As shown in the video, I’d need 164.26 to come into play, after which a bounce up to and a show of resistance at 164.64 opens the door for a lower-high and short-term bearish continuation.
EUR/JPY Four-Hour Chart
Chart prepared by James Stanley; data derived from Tradingview
GBP/JPY
For Yen-weakness, my preference is still with GBP/JPY. The pair similarly holds breakout potential like the above setup in EUR/JPY. From the weekly chart below, we can see that price is in a familiar area that’s held the highs for three of the past four weeks. Bulls are already up there again and if we do see Yen-weakness take over, I like upside potential in GBP/JPY more than either of the above markets of USD/JPY or EUR/JPY.
GBP/JPY Weekly Chart
Chart prepared by James Stanley; data derived from Tradingview
GBP/JPY Shorter-Term
From the daily chart we can see the struggle that bulls have had gaining acceptance above the 195.00 handle, which was resistance both on Wednesday and Thursday of last week. And so far for today, its an indecisive doji near the highs, which sets up that 195.00 level as deeper support potential. I think what’s notable here is the persistence that bulls have continued to show as given the higher-lows over the past four weeks, as that resistance in the 196.19-196.32 area has held the highs.
This takes on the form of an ascending triangle, which is often approached with aim of bullish breakouts.
And if bulls can force the break, the next major area of resistance potential on the chart is the 198.08 level, which is the top of the long-term gap in GBP/JPY.
GBP/JPY Daily Price Chart
Chart prepared by James Stanley; data derived from Tradingview
--- written by James Stanley, Senior Strategist
Related tags:
Latest market news



Open an account in minutes
Experience award-winning platforms with fast and secure execution, and enjoy tight spreads from 0.5 pts on FX and 0.3 pts on indices.
Economic calendar
Web Trader platform
Our sophisticated web-based platform is packed with features.
Related articles
Gold Price Forecast: XAU/USD Avoids Breakdown as Yields Surged but Can it Continue?
Surging Treasury yields sent a jolt across markets last week but, so far, gold prices have held above the FOMC low. The big question now is whether that can continue and, if not, will bulls show up at $4100 or $4k like they did in June and July?

Equity Indices Q4, 2026 Outlook: Cracks Begin to Show
There's still an open door for a melt-up in the S&P 500 and Nasdaq but the Dow and Russell 2000 are looking more vulnerable, and until calm hits the Treasuries market there's a higher probability for volatility. The big question is whether that's a next quarter theme or not.

USD/JPY Q4 2026 Outlook: Hawkish Fed Pricing Clashes With Intervention Risk
The year-end tug-of-war is clear: hawkish Fed pricing supports USD/JPY, while intervention risk limits the upside.

This report is intended for general circulation only. It should not be construed as a recommendation, or an offer (or solicitation of an offer) to buy or sell any financial products. The information provided does not take into account your specific investment objectives, financial situation or particular needs. Before you act on any recommendation that may be contained in this report, independent advice ought to be sought from a financial adviser regarding the suitability of the investment product, taking into account your specific investment objectives, financial situation or particular needs.
StoneX Financial Pte. Ltd., may distribute reports produced by its respective foreign entities or affiliates within the StoneX group of companies or third parties pursuant to an arrangement under Regulation 32C of the Financial Advisers Regulations. Where the report is distributed to a person in Singapore who is not an accredited investor, expert investor or an institutional investor (as defined in the Securities Futures Act), StoneX Financial Pte. Ltd. accepts legal responsibility to such persons for the contents of the report only to the extent required by law. Singapore recipients should contact StoneX Financial Pte. Ltd. at 6826 9988 for matters arising from, or in connection with the report.
In the case of all other recipients of this report, to the extent permitted by applicable laws and regulations neither StoneX Financial Pte. Ltd. nor its associated companies will be responsible or liable for any loss or damage incurred arising out of, or in connection with, any use of the information contained in this report and all such liability is hereby expressly disclaimed. No representation or warranty is made, express or implied, that the content of this report is complete or accurate.
StoneX Financial Pte. Ltd. is not under any obligation to update this report.
Trading CFDs carries a high level of risk that may not be suitable for some investors. Consider your investment objectives, level of experience, financial resources, risk appetite and other relevant circumstances carefully. The possibility exists that you could lose some or all of your investments, including your initial deposits. If in doubt, please seek independent expert advice. Visit www.forex.com/en-sg/terms-and-policies for the complete Risk Disclosure Statement.