



Nasdaq Technical Forecast: Bullish or Bearish Breakout Before Earnings?
Nasdaq Technical Forecast: Nasdaq consolidates below record highs ahead of earnings season. Key technical levels, earning reports, FOMC outlook, and breakout scenarios.
Share this:

The Nasdaq continues to consolidate below its record high near 30,700, trading within a narrowing range as investors rotate from AI-driven growth stocks toward cyclical sectors.
Rather than signalling weakness, this rotation could prove constructive, allowing the market to rebalance risk exposure and establish a stronger foundation for further gains before the second-quarter earnings season begins next week.
At the macro level, higher-for-longer Federal Reserve expectations continue to support Treasury yields and the US dollar, creating a headwind for high-growth technology stocks, where valuations remain elevated.
Although crude oil prices have unwound much of their geopolitical premium, easing longer-term inflation expectations, inflation remains above 4%, and uncertainty surrounding future Strait of Hormuz transit rules continues to leave a residual geopolitical risk premium in the market. Together, these factors keep stagflation risks on investors' radar. Crude Oil Weekly Outlook: Is Russia the Next Risk Premium for Oil Prices?
I mention these scenarios in the Daily MENA Market Call
Register here for the next call
Markets will also focus on Wednesday's FOMC minutes, looking for further insight into the new Federal Reserve leadership and its policy outlook. Combined with the seasonal slowdown in summer liquidity, these developments could increase volatility across US equity markets.
From a technical perspective, one principle remains particularly relevant: The longer a market consolidates, the stronger the eventual breakout tends to be.
Nasdaq Price Forecast: Daily Time Frame – Log Scale
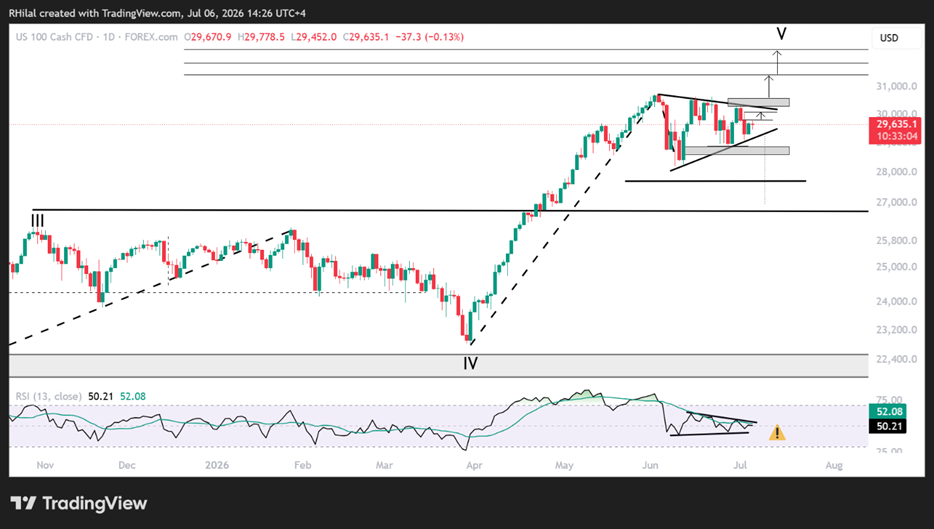
Source: Trading view
The daily chart shows a narrowing consolidation pattern developing since the June 2026 high.
Price continues to hold above the 28,800 support area while encountering resistance between 30,300 and 30,600.
Meanwhile, the daily RSI has returned to neutral territory near 50 after previously reaching overbought levels, suggesting momentum has cooled without confirming a broader bearish reversal.
This leaves two primary technical scenarios.
Bullish Breakout Scenario
A sustained breakout above 29,900, followed by 30,300 and 30,600—corresponding to the 23.6% and 27.2% Fibonacci extensions measured from the March low, June high, and June pullback—would confirm a continuation of the broader uptrend.
Upside targets include:
- 31,480 (32.8% extension)
- 31,900 (44% extension)
- 32,400 (50% extension)
These levels align with the projected measured move from the current consolidation pattern.
Bearish Breakout Scenario
A breakdown in daily momentum, with the RSI falling below 41, accompanied by a decisive break below 28,800–28,600, would expose key Fibonacci retracement targets of the April-June advance:
- 27,700
- 26,600
Within the broader secular bull market, these levels could present attractive long-term dip-buying opportunities rather than signalling a structural trend reversal.
Earnings Season: Key Reports to Watch Next Week
As markets position for the start of the US earnings season, several reports could determine whether the Nasdaq resumes its uptrend or extends its consolidation.
Wednesday, July 15
- ASML — AI semiconductor investment and chip equipment demand.
Thursday, July 16
- TSMC — AI chip demand, foundry outlook, and semiconductor industry guidance.
- Netflix — Subscriber trends, advertising revenue, and broader technology sentiment.
Key Themes to Monitor
- AI infrastructure spending.
- Semiconductor demand.
- Corporate guidance for the second half of 2026.
- The impact of a stronger US dollar on multinational earnings.
- Commentary on AI-related capital expenditure.
These earnings reports arrive at a critical moment, just as the Nasdaq transitions from an AI-led rally into a period of consolidation.
Strong guidance from ASML, TSMC, or Netflix, or the follow week's mega cap earning reports, could provide the catalyst needed for a bullish breakout, while weaker outlooks may extend the current range into the latter half of July.
Written by Razan Hilal, CMT
Follow on X: @Rh_waves
Related tags:
Latest market news




Open an account in minutes
Experience award-winning platforms with fast and secure execution, and enjoy tight spreads from 0.5 pts on FX and 0.3 pts on indices.
Economic calendar
Web Trader platform
Our sophisticated web-based platform is packed with features.
Related articles
RBA delivers 25bp hike, Bullock now the main event
The RBA delivered the expected 25bp hike, but Bullock’s press conference now looms as the bigger volatility risk for AUD/USD and the ASX 200.
Gold outlook: XAU/USD hammered, stretched and vulnerable to a sharp rebound
Gold is getting hammered for solid fundamental reasons, but history suggests extreme four-hourly oversold conditions can produce violent countertrend rallies.
EUR/USD, USD/JPY Outlook: Oil, yields and an FX identity crisis
Crude oil is setting the tone across rates and FX, leaving EUR/USD vulnerable and USD/JPY caught between higher Treasury yields and the growing threat of intervention
This report is intended for general circulation only. It should not be construed as a recommendation, or an offer (or solicitation of an offer) to buy or sell any financial products. The information provided does not take into account your specific investment objectives, financial situation or particular needs. Before you act on any recommendation that may be contained in this report, independent advice ought to be sought from a financial adviser regarding the suitability of the investment product, taking into account your specific investment objectives, financial situation or particular needs.
StoneX Financial Pte. Ltd., may distribute reports produced by its respective foreign entities or affiliates within the StoneX group of companies or third parties pursuant to an arrangement under Regulation 32C of the Financial Advisers Regulations. Where the report is distributed to a person in Singapore who is not an accredited investor, expert investor or an institutional investor (as defined in the Securities Futures Act), StoneX Financial Pte. Ltd. accepts legal responsibility to such persons for the contents of the report only to the extent required by law. Singapore recipients should contact StoneX Financial Pte. Ltd. at 6826 9988 for matters arising from, or in connection with the report.
In the case of all other recipients of this report, to the extent permitted by applicable laws and regulations neither StoneX Financial Pte. Ltd. nor its associated companies will be responsible or liable for any loss or damage incurred arising out of, or in connection with, any use of the information contained in this report and all such liability is hereby expressly disclaimed. No representation or warranty is made, express or implied, that the content of this report is complete or accurate.
StoneX Financial Pte. Ltd. is not under any obligation to update this report.
Trading CFDs carries a high level of risk that may not be suitable for some investors. Consider your investment objectives, level of experience, financial resources, risk appetite and other relevant circumstances carefully. The possibility exists that you could lose some or all of your investments, including your initial deposits. If in doubt, please seek independent expert advice. Visit www.forex.com/en-sg/terms-and-policies for the complete Risk Disclosure Statement.