



S&P 500, Nasdaq 100 Forecast for the Week Ahead
A hawkish Fed and 10-Year Notes on the verge of a push above 5%, yet stocks have so far shrugged off that fear. But can it continue?
Share this:

Equities Talking Points:
- It was a third consecutive week of indecision for Nasdaq 100 futures and the S&P 500 saw a strong bounce on Friday even after an inflation print that keeps the Fed on track for a rate hike next week.
- With bonds looking less and less attractive there’s still lacking opportunity cost for equity investors, but if we do see the 10-year crest above 5% and move towards the 5.25% that last traded in 2006 and 2007, that can shift.

The Nasdaq 100 is coiled, and given the backdrop, where inflation has remained high and expectations have pushed for a second rate hike by the end of the year, the deduction of that indecision over the past few weeks is that buyers have done an incredible job of responding to pullbacks.
The big test is next week, however, as the Fed is widely expected to hike rates by 25 basis points but perhaps the bigger item is the context surrounding that meeting. Kevin Warsh to this point has sounded rather hawkish, and this drove a pullback in equities after his first meeting in June by a strong rally after his second in late-July.
Nasdaq 100 Daily Chart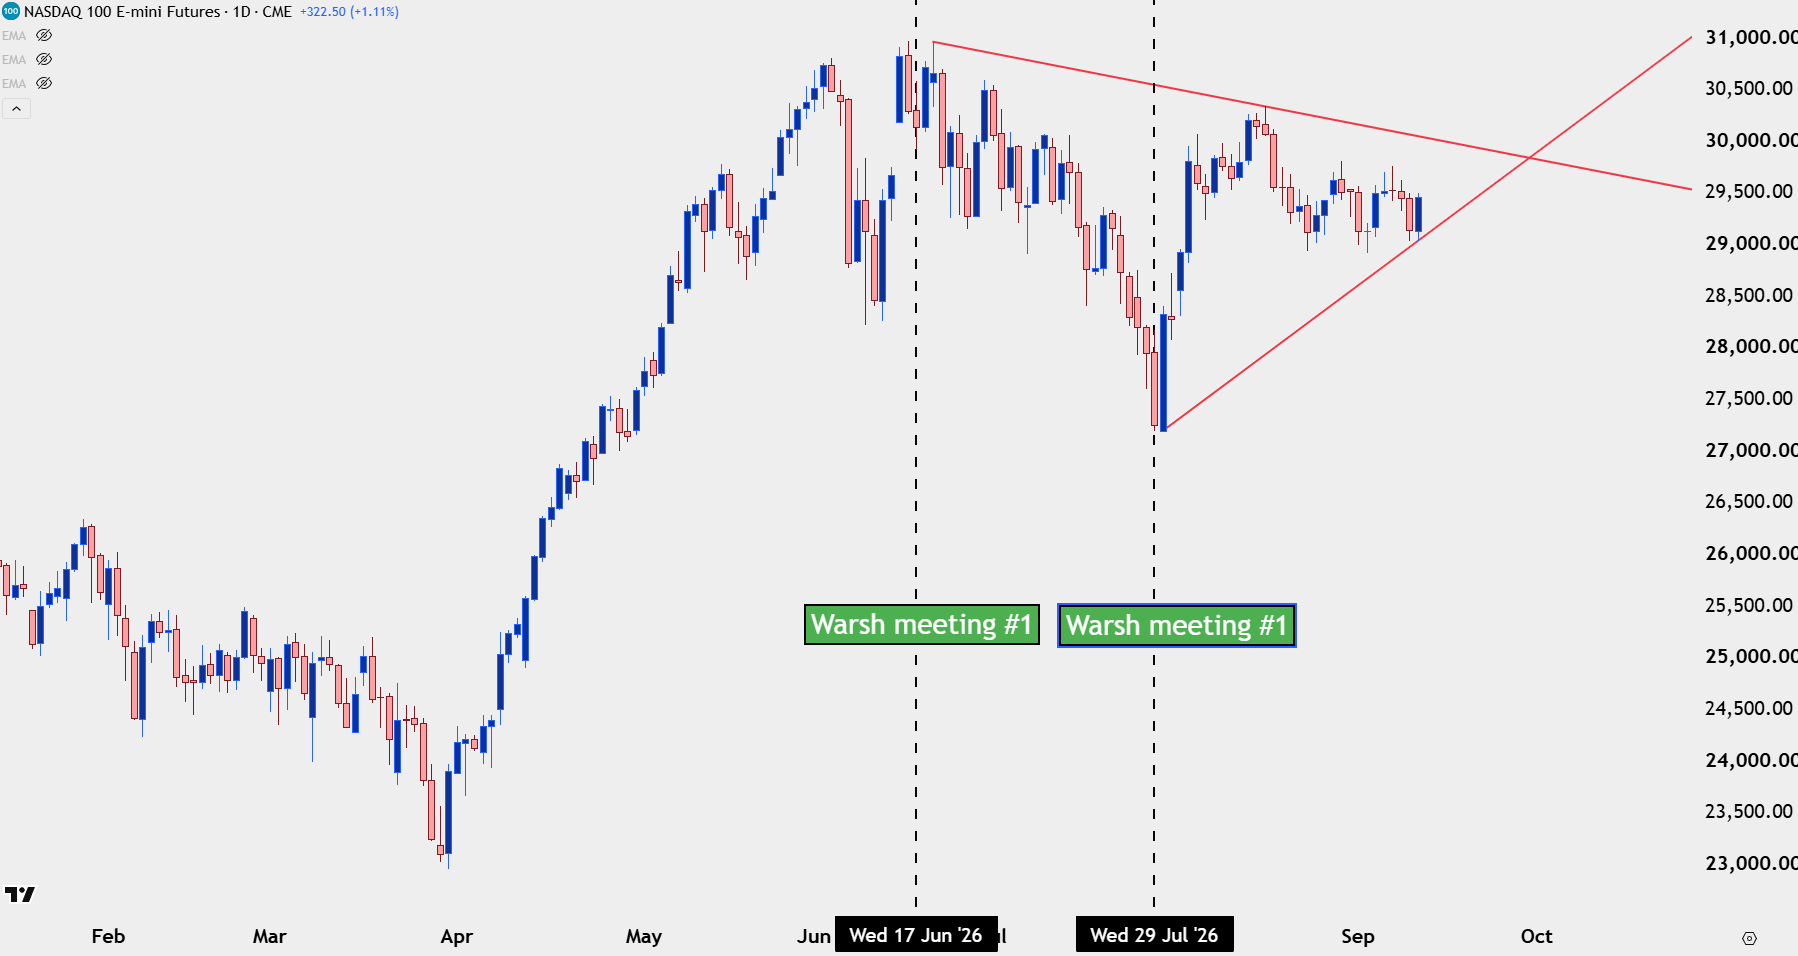
Chart prepared by James Stanley; data derived from Tradingview
Perhaps most important is how markets perceive Warsh’s opinion of the wealth effect, or the premise that stronger equity markets help to drive economic activity. While this was something widely ignored 20 years ago, after the Financial Collapse it became a bigger item for the FOMC and it’s at least part of the reason why we got multiple rounds of QE and a bloated balance sheet that the Federal Reserve continues to carry.
There’s little vested interest in economic destruction so in multiple episodes, we’ve seen the Fed ignore above target inflation or even cut rates well-before CPI or PCE dropped below their own self-imposed 2% target.
That’s not where we are right now, however, as Warsh has highlighted this failure from the Fed to get inflation back-below goal and, instead, he’s prioritized this push. He made a convincing case in June, which is why equities sold off. But in July, with inflation still high and markets assigning a rough coin flip for a rate hike, he didn’t vote to tighten policy. The aftermath was a strong rally in both the Nasdaq and S&P 500 with the latter setting another fresh ATH. In the Nasdaq, the index has been a bit more cautious and this highlights a point of divergence that traders should take note of as we go into next week’s Fed meeting.
Nasdaq 100 (in Black) v/s S&P 500 (in Blue), Daily Chart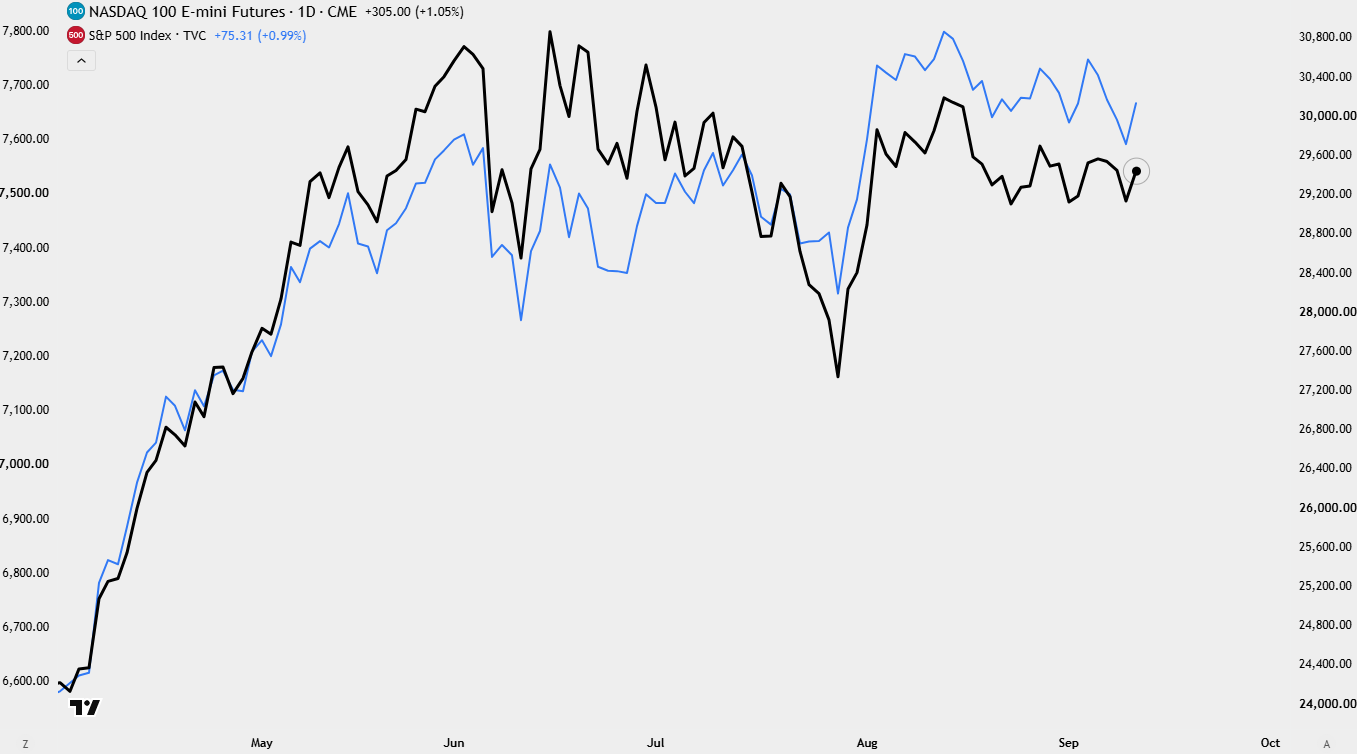
Chart prepared by James Stanley; data derived from Tradingview
Nasdaq Lags S&P 500
The risk at this point is the fact that what was previously the leader into the first Fed meeting with Kevin Warsh, tech stocks and the AI trade, have started to lag behind the S&P 500.
This is similar to early 2000, when tech stocks topped well before the S&P, which was an early warning sign that the massive driver of equity strength was starting to slow down. There was a similar yield scenario taking place at the time, as well, as Treasury yields had jumped and seemingly offered an opportunity cost to market participants, who now had the option of locking up 6% in long-term bonds versus chasing yet another bounce in the dot com trade.
And this is where the grind sets up for next week, as the 10-year Treasury Note came just one basis point away from hitting the psychologically important 5% mark. Behind the push is the expectation for supply coming from a Treasury department that’s going to have to pay back principal on a considerable amount of long-term debt. But, also of issue is a US government that continues to spend, backed by a central bank that, to this point, hasn’t seemed serious about the 2% inflation target.
This is, after all, what initially drove the breakout in gold beyond the $2k level back in February of 2024, as Fed members talked up rate cut potential later in the year even with inflation far beyond their own self-imposed target. It’s perhaps also one of the big reasons why after that rate cut in September, bond markets sold off and yields went up, pretty much the opposite of what the Fed had wanted to see; because market participants aren’t usually going to ignore the fact that above-target inflation being surrounded by softer policy and lower rates will, likely, create higher levels of inflation down the road. And that will cut into bond returns and there’s even less reason to hold Treasuries for 10 or 30 years.
This is the delicate balancing act that Warsh has to walk, and it’s probably why he’s sounded as hawkish as he has even though President Trump had promised during the nomination process that ‘a willingness to cut rates is a litmus test for the next Fed Chart.’
Well, to this point, it’s been the opposite, and markets have seemingly warmed up to that fact. But Warsh will have to continue walking that delicate tightrope next week if he is to keep equity markets floating higher.
In the Nasdaq 100, it’s been the 30k level that’s been problematic, so I’m looking at that for an early indication of how that meeting is perceived. Support, meanwhile, is just below the $29 level and a breach of that will also be a break of the lower trendline from the symmetrical triangle that’s formed since Warsh’s introductory press conference. That would show bears taking greater control and the door for a deeper slide would open wider.
Nasdaq 100 Daily Chart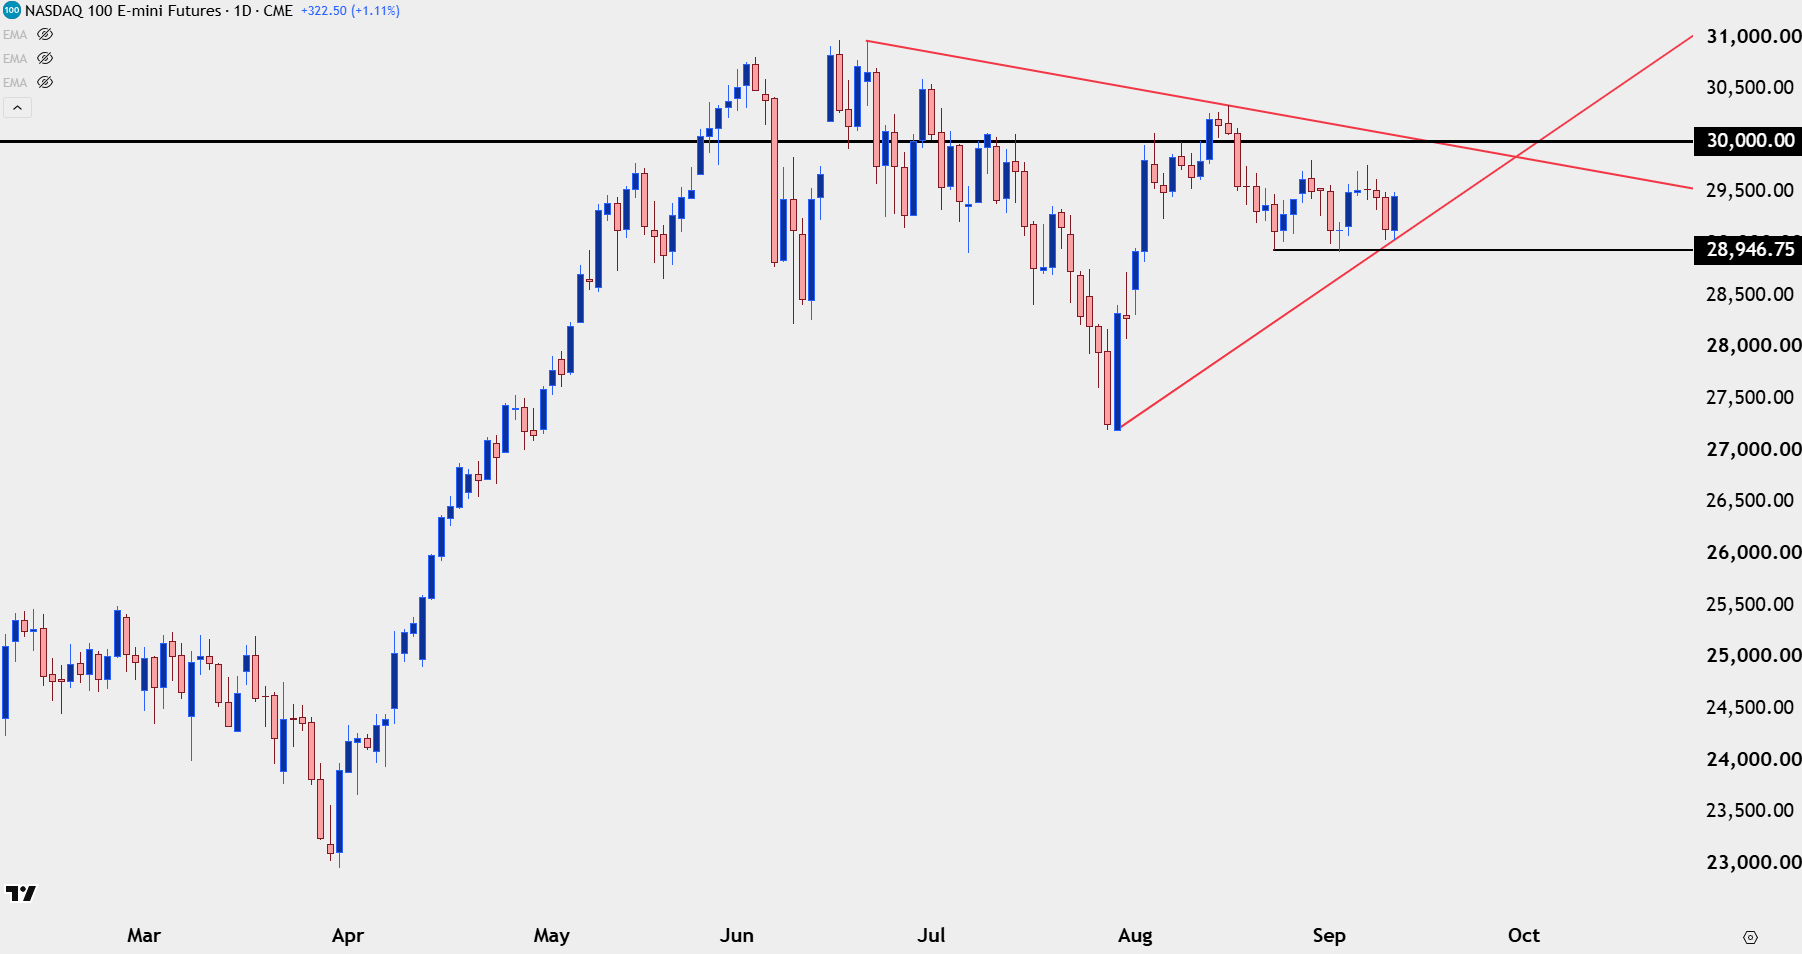
Chart prepared by James Stanley; data derived from Tradingview
SPX
The S&P 500 has fared better by comparison, as the index hit a fresh all-time-high just last month and the pullback from that has, so far, been controlled. That’s not to say that higher yields haven’t produced a bit of fear as last week saw a lower-low test a massive spot of support, as taken from prior resistance. The daily doji on Thursday set up for an ‘abandoned baby formation’ which is a gap-down followed by a doji followed by a bullish gap-up. It’s similar in tone to a morning start which is often looked at with aim of bullish reversal.
And on that front, comparing the recent digestion in the Nasdaq 100 shows a greater bullish influence in SPX, as there’s been a bearish channel which sets up a bull flag formation in the index.
SPX Daily Chart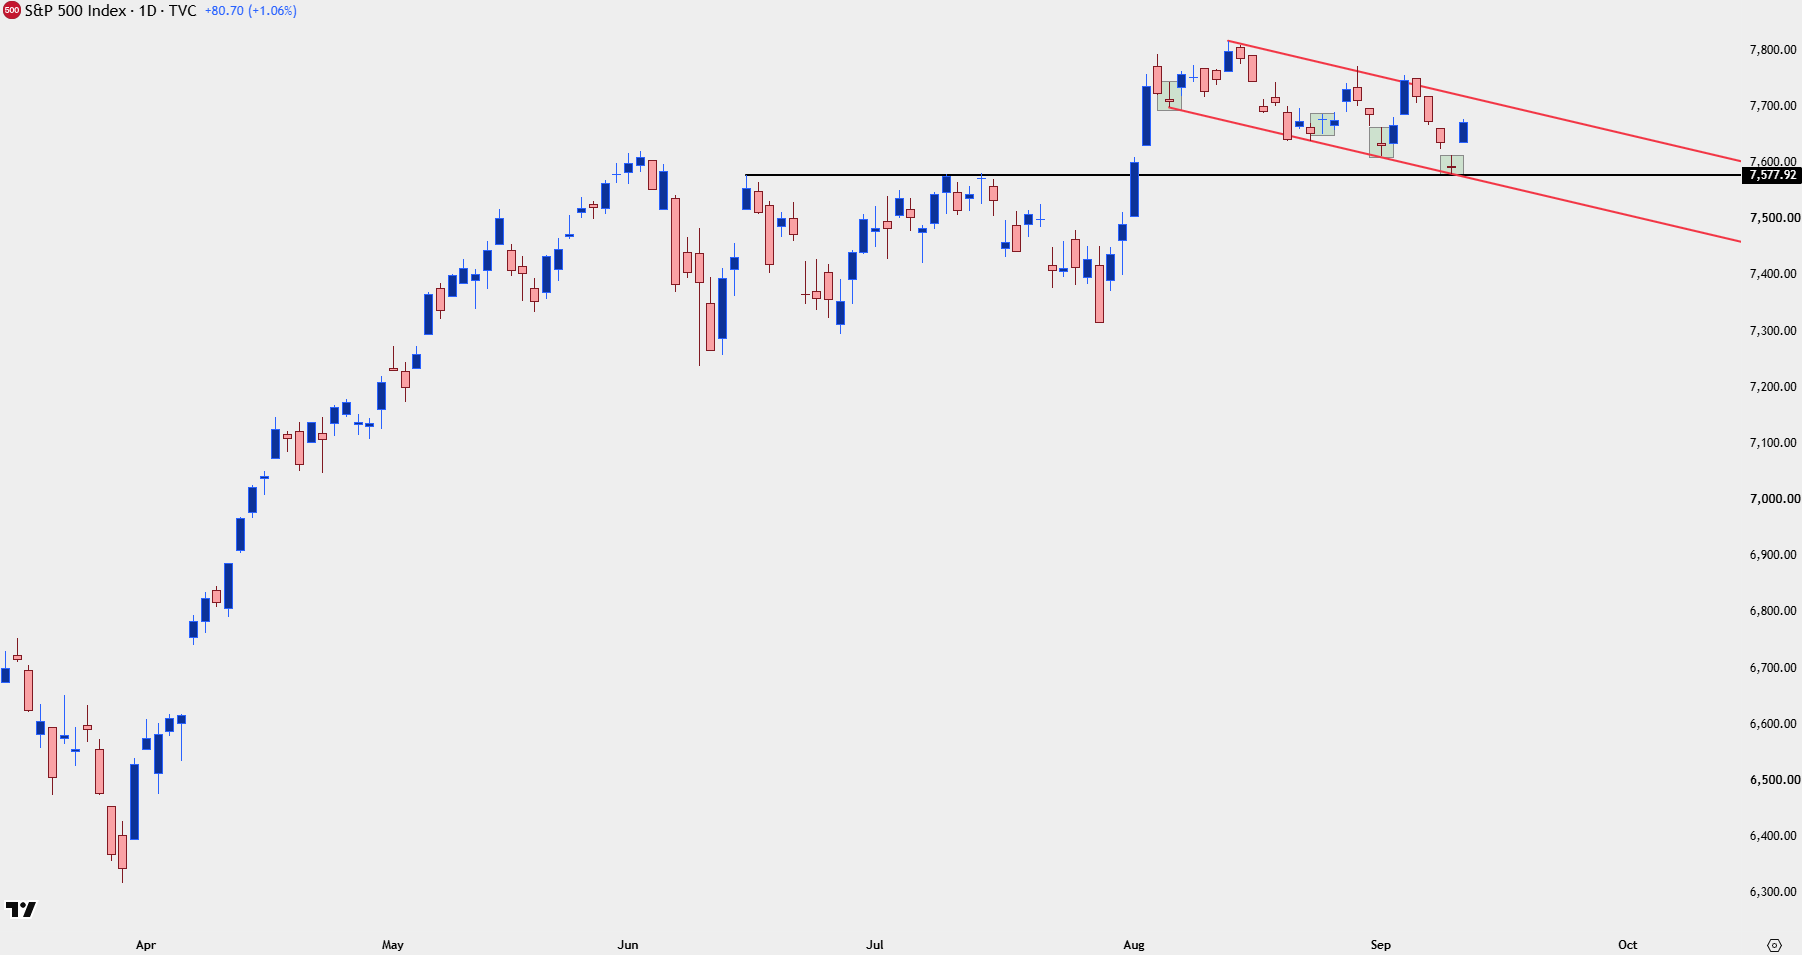
Chart prepared by James Stanley; data derived from Tradingview
Strategy for Next Week
Comparatively, the S&P 500 retains bullish appeal while bearish scenarios would probably show more prominently in the tech heavy Nasdaq 100, especially given the build of a non-directional symmetrical triangle compared to the bull flag in the S&P 500.
--- written by James Stanley, Senior Market Analyst, Global Macro
Related tags:




Open an account in minutes
Experience award-winning platforms with fast and secure execution, and enjoy tight spreads from 0.5 pts on FX and 0.3 pts on indices.
Economic calendar
Web Trader platform
Our sophisticated web-based platform is packed with features.
Related articles

Nasdaq 100 Forecast: NDX rises further with Middle East developments in focus
U.S. stocks are heading for a modestly stronger start as investors awaited developments over potential talks between the U.S. and Iran.


Nikkei threatens breakout as tech rebound broadens
Breakouts across the SOX and Nasdaq are being matched by rebounds across Asia, with the Nikkei now threatening to join the move.


Nasdaq 100 Forecast: Confidence Returns as the Index Challenges Record Highs
The trading week is getting underway with renewed bullish momentum across Nasdaq. This is reflected in today's session, where the index has gained more than 2.5%, highlighting a buying bias that has not been observed with this level of strength in several weeks.

This report is intended for general circulation only. It should not be construed as a recommendation, or an offer (or solicitation of an offer) to buy or sell any financial products. The information provided does not take into account your specific investment objectives, financial situation or particular needs. Before you act on any recommendation that may be contained in this report, independent advice ought to be sought from a financial adviser regarding the suitability of the investment product, taking into account your specific investment objectives, financial situation or particular needs.
StoneX Financial Pte. Ltd., may distribute reports produced by its respective foreign entities or affiliates within the StoneX group of companies or third parties pursuant to an arrangement under Regulation 32C of the Financial Advisers Regulations. Where the report is distributed to a person in Singapore who is not an accredited investor, expert investor or an institutional investor (as defined in the Securities Futures Act), StoneX Financial Pte. Ltd. accepts legal responsibility to such persons for the contents of the report only to the extent required by law. Singapore recipients should contact StoneX Financial Pte. Ltd. at 6826 9988 for matters arising from, or in connection with the report.
In the case of all other recipients of this report, to the extent permitted by applicable laws and regulations neither StoneX Financial Pte. Ltd. nor its associated companies will be responsible or liable for any loss or damage incurred arising out of, or in connection with, any use of the information contained in this report and all such liability is hereby expressly disclaimed. No representation or warranty is made, express or implied, that the content of this report is complete or accurate.
StoneX Financial Pte. Ltd. is not under any obligation to update this report.
Trading CFDs carries a high level of risk that may not be suitable for some investors. Consider your investment objectives, level of experience, financial resources, risk appetite and other relevant circumstances carefully. The possibility exists that you could lose some or all of your investments, including your initial deposits. If in doubt, please seek independent expert advice. Visit www.forex.com/en-sg/terms-and-policies for the complete Risk Disclosure Statement.