



S&P 500 Analysis: SPX Pulls Back Steadily from All-Time Highs
Over the past four trading sessions, the S&P 500 (SPX) has declined by more than 1.2% from its all-time highs, as a new bearish bias begins to gain relevance in the short term. Selling pressure has persisted in part because long-term equity market confidence remains in neutral territory, while ongoing shifts in the Federal Reserve’s outlook for 2026 have started to weigh on recent demand.
Share this:

Over the past four trading sessions, the S&P 500 (SPX) has declined by more than 1.2% from its all-time highs, as a new bearish bias begins to gain relevance in the short term. Selling pressure has persisted in part because long-term equity market confidence remains in neutral territory, while ongoing shifts in the Federal Reserve’s outlook for 2026 have started to weigh on recent demand. This lack of clarity has prevented a sustained buying interest from taking hold in the index. If this environment persists, selling pressure could gain further traction in the sessions ahead.


No Clear Path Forward?
The start of 2026 has been accompanied by a persistent sense of neutrality across equity markets, mainly because there is still no clear indication of when the next rate cut by the Federal Reserve might occur. It is important to recall that one of the key confidence catalysts for equities is the expectation of lower interest rates, as these reduce borrowing costs, boost liquidity, and support consumption—key drivers of demand for equities and, by extension, the SPX.
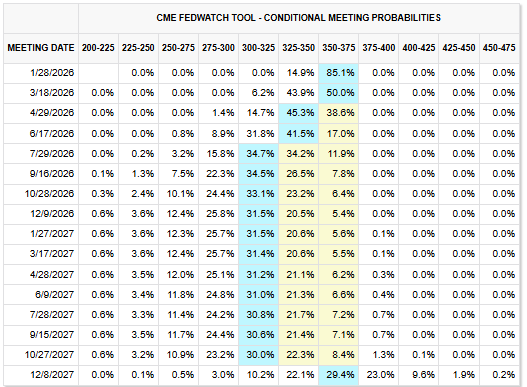
However, the Federal Reserve’s probability outlook at the beginning of the year points to a neutral rate environment. Currently, markets assign an 85.1% probability that rates will remain unchanged at the January 28 meeting, and close to 50% that this stance will also be maintained at the March 18 meeting. This scenario pushes back expectations of near-term rate cuts and reinforces policy indecision, limiting the recovery of confidence in the equity market.
Source: CMEGROUP
This backdrop has begun to reduce the likelihood that equities will benefit from lower interest rates in the short term and has encouraged flows into other markets, such as bonds, which tend to perform better in neutral-rate environments. As bonds gain relative appeal, demand for equity indices may be displaced. In the absence of strong macroeconomic data during the early sessions of the year, this cautious sentiment appears to be prevailing. Until there is greater clarity around potential rate cuts during the first quarter of 2026, this environment may continue to act as a drag on confidence and lead to more consistent selling pressure in the SPX.
What About Long-Term Confidence?
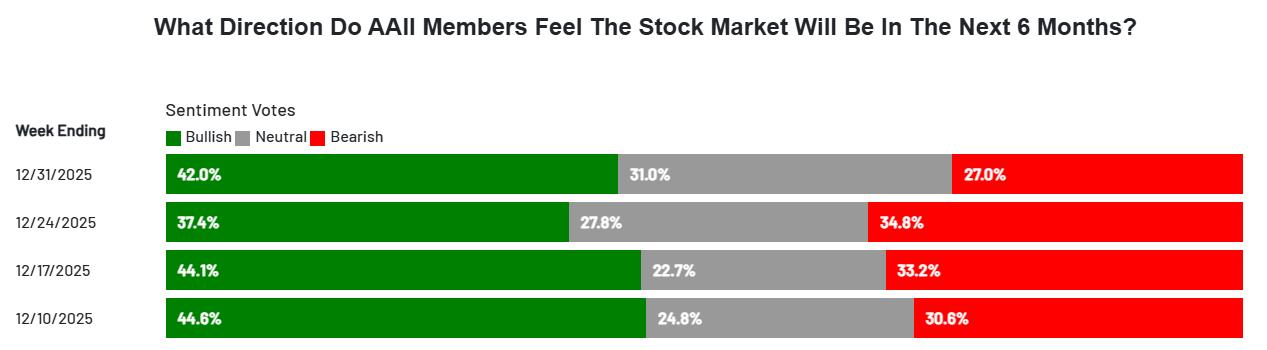
Beyond short-term uncertainty, long-term confidence also shows signs of indecision. According to the AAII Investor Sentiment Survey, 42% of investors hold a bullish outlook for equities over the next six months. However, 31% remain neutral and 27% maintain a bearish stance, highlighting a lack of clear consensus on the market’s future direction.
Source: AAII
As long as the index fails to show a meaningful improvement in optimism, this long-term indecision may continue to limit the formation of solid buying demand in the short term. Without a clear shift in sentiment, SPX may continue to move through a phase of uncertainty, potentially fueling additional episodes of selling pressure in the coming sessions.
S&P 500 Technical Outlook
Source: StoneX, Tradingview
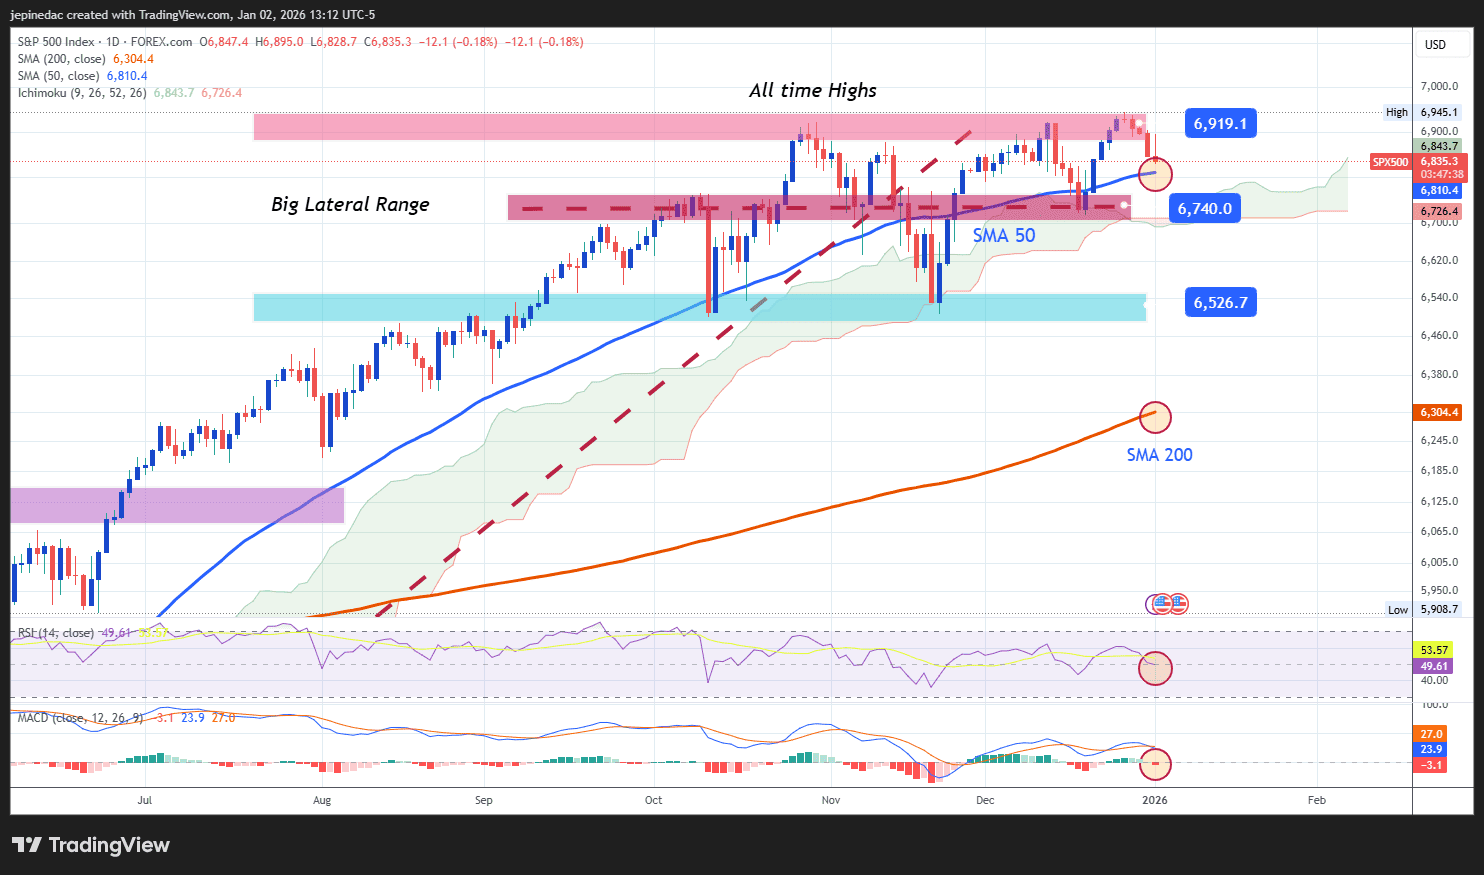
- A well-defined sideways range remains in place: Over recent months, SPX has traded within a clearly defined consolidation range, capped near 6,900 points and supported around 6,500 points. So far, price action has not been strong enough to break this structure, leaving the range as the most relevant technical formation to monitor. As long as these dynamic holds, it will be difficult for clear directional trends to emerge in the short term.
- RSI: The RSI continues to oscillate around the neutral 50 level, indicating a balance between buying and selling forces over the past 14 sessions. This behavior reinforces the view of a market in a neutral phase, where indecision may continue to dominate index movements.
- MACD: The MACD also reflects persistent neutrality, with its histogram hovering near the zero line. This suggests balanced short-term moving average momentum and supports the idea that a lack of directional impulse may continue to limit the emergence of consistent demand in SPX.
Key Levels:
- 6,900 points – Key resistance: This level aligns with the index’s all-time highs and represents the most important short-term upside barrier. A sustained move above this area could reactivate a dominant bullish bias, bring the consolidation range to an end, and open the door to a renewed bullish phase similar to that seen during part of 2025.
- 6,700 points – Nearby barrier: A level corresponding to a recent low. A break below this area could trigger a short-term bearish bias, keeping the consolidation structure intact in the sessions ahead.
- 6,500 points – Key support: This level corresponds to the most relevant lows from November 2025 and aligns with the lower boundary of the consolidation range. Sustained moves toward this zone could put the consolidation structure at risk and open the door to a more defined bearish trend.
Written by Julian Pineda, CFA, CMT – Market Analyst
Follow him on: @julianpineda25
Latest market news




Open an account in minutes
Experience award-winning platforms with fast and secure execution, and enjoy tight spreads from 0.5 pts on FX and 0.3 pts on indices.
Economic calendar
Web Trader platform
Our sophisticated web-based platform is packed with features.
Related articles

S&P 500 forecast: Stocks extend drop as correction risks grow
US and global equity markets have extended Wednesday’s sell-off, with Wall Street opening lower after a weak handover from Asia and Europe. The deterioration in risk appetite has been spreading across global markets. The dollar was firmer, Treasury yields were holding onto yesterday’s gains, while gold, silver and bitcoin were all under pressure alongside equities and major currencies.


ASX 200 Rebound Stalls Despite Wall Street Surge
The ASX 200 rebound is struggling for traction despite a powerful Wall Street rally, leaving 8800 resistance and downside risks in focus.


Nikkei threatens breakout as tech rebound broadens
Breakouts across the SOX and Nasdaq are being matched by rebounds across Asia, with the Nikkei now threatening to join the move.
This report is intended for general circulation only. It should not be construed as a recommendation, or an offer (or solicitation of an offer) to buy or sell any financial products. The information provided does not take into account your specific investment objectives, financial situation or particular needs. Before you act on any recommendation that may be contained in this report, independent advice ought to be sought from a financial adviser regarding the suitability of the investment product, taking into account your specific investment objectives, financial situation or particular needs.
StoneX Financial Pte. Ltd., may distribute reports produced by its respective foreign entities or affiliates within the StoneX group of companies or third parties pursuant to an arrangement under Regulation 32C of the Financial Advisers Regulations. Where the report is distributed to a person in Singapore who is not an accredited investor, expert investor or an institutional investor (as defined in the Securities Futures Act), StoneX Financial Pte. Ltd. accepts legal responsibility to such persons for the contents of the report only to the extent required by law. Singapore recipients should contact StoneX Financial Pte. Ltd. at 6826 9988 for matters arising from, or in connection with the report.
In the case of all other recipients of this report, to the extent permitted by applicable laws and regulations neither StoneX Financial Pte. Ltd. nor its associated companies will be responsible or liable for any loss or damage incurred arising out of, or in connection with, any use of the information contained in this report and all such liability is hereby expressly disclaimed. No representation or warranty is made, express or implied, that the content of this report is complete or accurate.
StoneX Financial Pte. Ltd. is not under any obligation to update this report.
Trading CFDs carries a high level of risk that may not be suitable for some investors. Consider your investment objectives, level of experience, financial resources, risk appetite and other relevant circumstances carefully. The possibility exists that you could lose some or all of your investments, including your initial deposits. If in doubt, please seek independent expert advice. Visit www.forex.com/en-sg/terms-and-policies for the complete Risk Disclosure Statement.