




S&P 500, Gold Analysis: Commitment of traders report (COT) – 12th June 2023
The commitment of traders (COT) report shows how large speculators are positioned across futures markets on the CME exchange.
Share this:

View this week's events and trading themes which could drive markets: The Week Ahead
View this week's events and trading themes which could drive markets: The Week Ahead
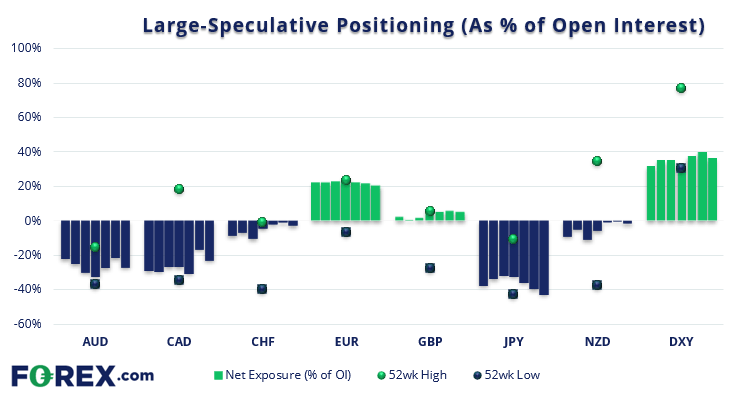
Commitment of traders (forex) as of Tuesday 6th June 2023:
- Large speculators trimmed their net-long exposure for a third week
- Net-short exposure to JPY futures rose to a 2-year high
- AUD futures traders trimmed -14.7k long contracts (-21%)
- Gross long exposure to CHF futures rose to a 40-week high (but large speculators remain slightly net-short at -1.3k contracts)

This content will only appear on City Index websites! Read our guide on how to interpret the weekly COT report
This content will only appear on Forex websites! Read our guide on how to interpret the weekly COT report
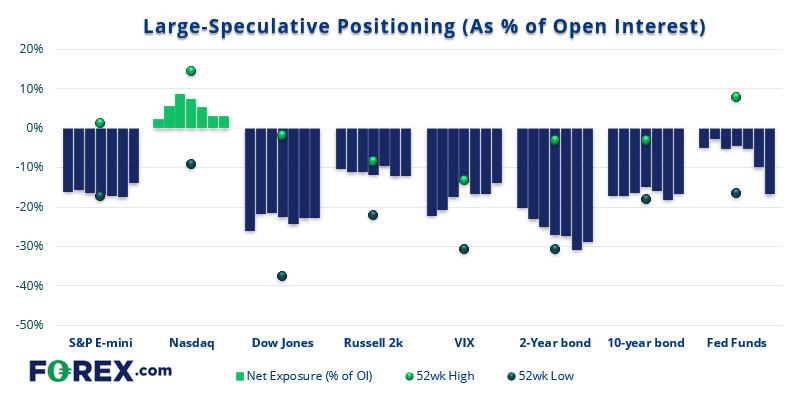
Commitment of traders (indices, bonds) as of Tuesday 6th June 2023:
- Net-short exposure to the 30-day Fed Fund Futures contract increased by 37% as traders bet on a more hawkish Fed
- Open interest to VIX futures rose to its highest level since March 2020
- Net-short exposure for the 2 and 10-year bond futures contracts pulled back from their record highs last week

S&P 500 Commitment of traders:
We had noted the potential for a sentiment extreme on the S&P 500, given traders were fast approaching (an then eventually arrived at) their most net-short exposure on record. A sharp rise of gross longs saw net-short exposure fall at its fastest pace in 24 weeks and second fastest in 14 months. Interestingly, it has yet to trigger the short-covering rally we had anticipated, with only -18.8 gross shorts being trimmed relative to the 71.1k long contracts initiated, but the higher the S&P 500 traders the more pressure bearish speculators will be to cover, which in theory could send the futures prices higher.


S&P 500 daily chart:
So all eyes are on the S&P 500 cash index August high of 4325.28, to see if a bullish breakout triggers its next round of bullish initiation and short covering. A small bearish hammer formed on Friday just beneath resistance, so there does appear to be some hesitancy to break immediately higher, and that leaves the potential for a pullback towards 4323.43 on the cards, in an attempt to close the gap. But, as things stand, an eventual upside break is under consideration given that prices are trending higher yet the vast majority of large speculators are caught short.
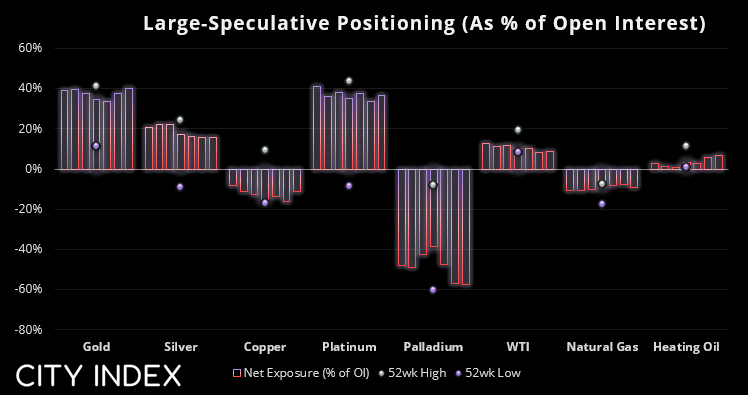
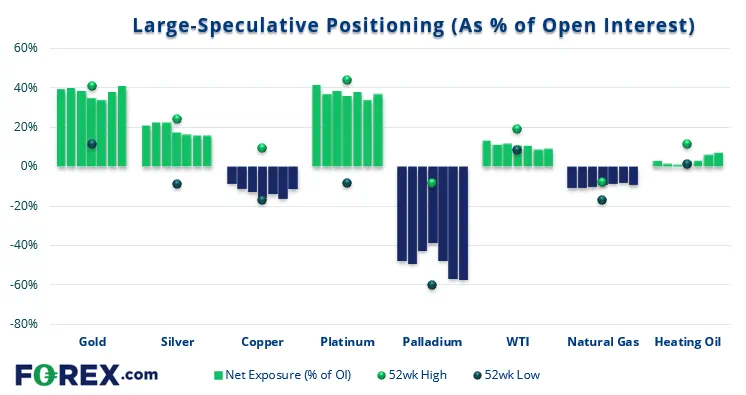
Commitment of traders (commodities) as of Tuesday 6th June 2023:
- Net-short exposure to copper futures fell by 9.8k contracts (-27.3%)
- Gross-short exposure to gold futures fell to a 2-year, 2-month low
- Large speculators reduced their gross-short exposure to platinum futures by -25.1%
- Large speculators were their most bearish on palladium futures in 8 weeks
Gold weekly chart:
Net-long exposure among large speculators rose by a mild 6.3k contracts last week, and that was mostly a function of short covering as only 161 gross longs were added compared to -6,164 shorts closed. And as we saw gold prices print a small bullish candle last week, perhaps there’s a case for an interim low (although this could be down to how hawkish or not the Fed’s meeting is this week). If the Fed surprise with a dovish hold, we suspect could break comfortably above $2000. Although a more likely outcome is for the Fed to hold and deliver a hawkish ‘warning’ to keep inflation expectations in check, but that could still be supportive of gold over the near term. A surprise hike could send gold to a new cycle low.
How to trade with City Index
You can easily trade with City Index by using these four easy steps:
- Open an account, or log in if you’re already a customer
• Open an account in the UK
• Open an account in Australia
• Open an account in Singapore
- Search for the company you want to trade in our award-winning platform
- Choose your position and size, and your stop and limit levels
- Place the trade
Related tags:
Latest market news




Open an account in minutes
Experience award-winning platforms with fast and secure execution, and enjoy tight spreads from 0.5 pts on FX and 0.3 pts on indices.
Economic calendar
Web Trader platform
Our sophisticated web-based platform is packed with features.
Related articles
US Core PCE Preview: Stale or Significant for the Fed
Core PCE inflation takes center stage Wednesday, with traders watching for signs of renewed price pressure and clues on whether the Fed could hike again in October.
Australian Dollar Forecast: AUD/USD Four-Week Slide Nears Critical Uptrend Support 9 29 2026
Aussie momentum has deteriorated sharply into quarter-end, with inflation, Core PCE and NFP on tap as AUD/USD closes in on a pivotal technical threshold.

Euro Forecast: EUR/USD Tumbles Towards Yearly Low as Daily RSI Goes Oversold
EUR/USD has been hit hard in the final month of the quarter as USD strength has shown up in a big way. With the pair set to challenge its yearly low as RSI has pushed into oversold territory, is there a chance for a pullback with some big headline risk hitting in the US over the next few days?

This report is intended for general circulation only. It should not be construed as a recommendation, or an offer (or solicitation of an offer) to buy or sell any financial products. The information provided does not take into account your specific investment objectives, financial situation or particular needs. Before you act on any recommendation that may be contained in this report, independent advice ought to be sought from a financial adviser regarding the suitability of the investment product, taking into account your specific investment objectives, financial situation or particular needs.
StoneX Financial Pte. Ltd., may distribute reports produced by its respective foreign entities or affiliates within the StoneX group of companies or third parties pursuant to an arrangement under Regulation 32C of the Financial Advisers Regulations. Where the report is distributed to a person in Singapore who is not an accredited investor, expert investor or an institutional investor (as defined in the Securities Futures Act), StoneX Financial Pte. Ltd. accepts legal responsibility to such persons for the contents of the report only to the extent required by law. Singapore recipients should contact StoneX Financial Pte. Ltd. at 6826 9988 for matters arising from, or in connection with the report.
In the case of all other recipients of this report, to the extent permitted by applicable laws and regulations neither StoneX Financial Pte. Ltd. nor its associated companies will be responsible or liable for any loss or damage incurred arising out of, or in connection with, any use of the information contained in this report and all such liability is hereby expressly disclaimed. No representation or warranty is made, express or implied, that the content of this report is complete or accurate.
StoneX Financial Pte. Ltd. is not under any obligation to update this report.
Trading CFDs carries a high level of risk that may not be suitable for some investors. Consider your investment objectives, level of experience, financial resources, risk appetite and other relevant circumstances carefully. The possibility exists that you could lose some or all of your investments, including your initial deposits. If in doubt, please seek independent expert advice. Visit www.forex.com/en-sg/terms-and-policies for the complete Risk Disclosure Statement.