





S&P 500 Tempts ATH Breakout After USD Drawdown
Stock prices have been very volatile on an intra-day basis but less so in the bigger picture, as S&P 500 futures have traded within a 5.6% range over the past two months.
Share this:

S&P 500 Talking Points:
- Volatility has been there for intra-day equity traders of late, but bigger picture it’s been a grind as prices have been within a 3.68% range over the past few weeks and a 5.6% range over the past two months.
- The recent low in stocks coincided with the high in the U.S. Dollar, and if we do see the Dollar sell-off continue, there could be motive for the S&P 500 to finally break the impasse and trade up to a fresh all-time-high.
- I looked at equities as my top trade idea for 2025 and the first zone of support from that has already came into play, which has helped to mark the current 2025 low for the S&P 500. I discussed this in the 2025 Forecast for Equities, as well, which you can access from the link below:
For intra-day traders, there’s been opportunity in equities for this year but for those with a longer-term time frame, they’ve probably been left wanting. In the S&P 500 it’s been tough sledding for bulls at 6150 which is currently working on its third separate test. The first happened just ahead of the December FOMC rate decision, and this is when the Fed started to sound less dovish as they posed their third consecutive rate cut.
That unsettled the mood, to a degree, as the post-election breakout finally started to go into reverse, and that largely held for most of the next month as prices continued to dip into the New Year.
But – support played at the bottom of the election gap. That gap is smaller in S&P 500 futures and wider in the cash market of SPX, which is what I had looked at for the top trade idea of 2025 and the equity forecast for this year. There’s a gap in S&P 500 futures, as well, and I’ve marked that with a red dashed line below. That level helped to mark the low on January 13th and that’s when matters began to turn, in both stocks and the U.S. Dollar.
S&P 500 Futures Daily Price Chart
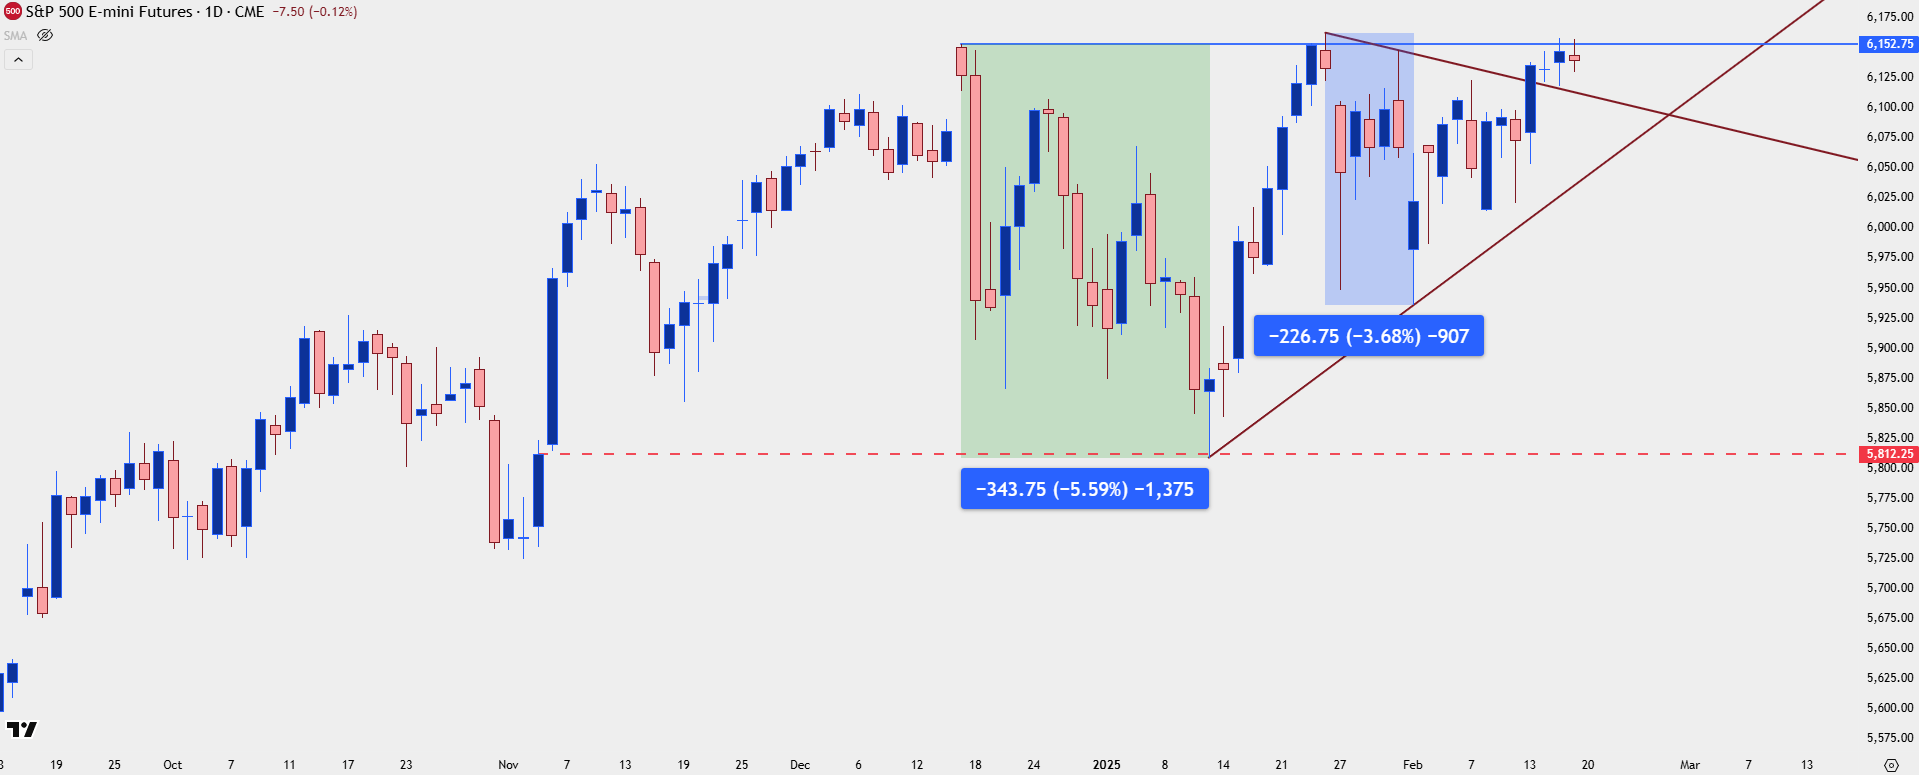 Chart prepared by James Stanley; data derived from Tradingview
The January 13th Turn
The January 13th turn was important for both stocks and currencies, as that marked both the low in SPX and the high in the U.S. Dollar via DXY. And this harkens back to something I was speaking about since the election, when the post-election run saw U.S. assets running higher in tandem as both the U.S. Dollar and U.S. equities continued to gain, even as Treasury yields were running higher. As I said then, I expected those markets to diverge, at some point, and my expectation was that the Dollar was pullback and equities would break out.
At this point it appears that we may be on the verge of something along those lines. The U.S. Dollar has continued to show a pattern of lower-lows and lower-highs, and as I looked at in yesterday’s webinar, it’s looking more and more like the USD has topped for this cycle.
The risk to that theme, at this point, appears to bear some relation to the equities backdrop as it’s the threat or prospect of tariffs that could both strengthen the USD and weaken equities. We’ve already seen that dynamic at work in early-February.
S&P 500 futures gapped down aggressively as the USD jumped after the weekly open, driven by the threat of tariffs on Canada coming into play. That gap is represented in green on the below chart and notice the higher-highs and lows that’s printed since then, going along with the lower-lows and highs in the USD since that episode.
S&P 500 Futures – Four-Hour Chart
 Chart prepared by James Stanley; data derived from Tradingview
The Necessity of Adaptation
As I mentioned in the first line of this article, there’s been opportunity for intra-day traders. It may not have been an easy path, but there’ve been multiple pullbacks in equities that have allowed for establishment of bullish exposure.
The election gap on January 13th was an obvious area and I had looked at that as my ‘s1’ zone for this year. But a couple weeks later, there was a strong gap-down on the back of DeepSeek fears, or the Chinese AI LLM that triggered a host of worries that the AI bubble in the U.S. may soon pop. There was a gap-down on that open but there was also continued selling shortly after the weekly open. But the rest of the week saw recovery until that gap had filled.
And then the next week saw another gap-down, this time on fears of tariffs. But, again, that risk soon dissipated, and bulls pushed the S&P 500 right back up to resistance.
The next week brought even more fears around tariffs but, similarly, bulls jumped on the bid and closed the gap quickly, again, running price back above 6100 in short order.
Notably this hasn’t amounted for any prolonged trends but, again, for intra-day traders there’s been numerous pullback setups. The VIX index remains low, currently reading below 16, and this makes establishment of longer-term exposure a bit more daunting. But it’s the spikes above 20 that have highlighted opportunities of late, as there’s been three such occurrences and each has come along with pullbacks in the S&P 500. This is a factor that could continue to remain of interest.
VIX Daily Chart
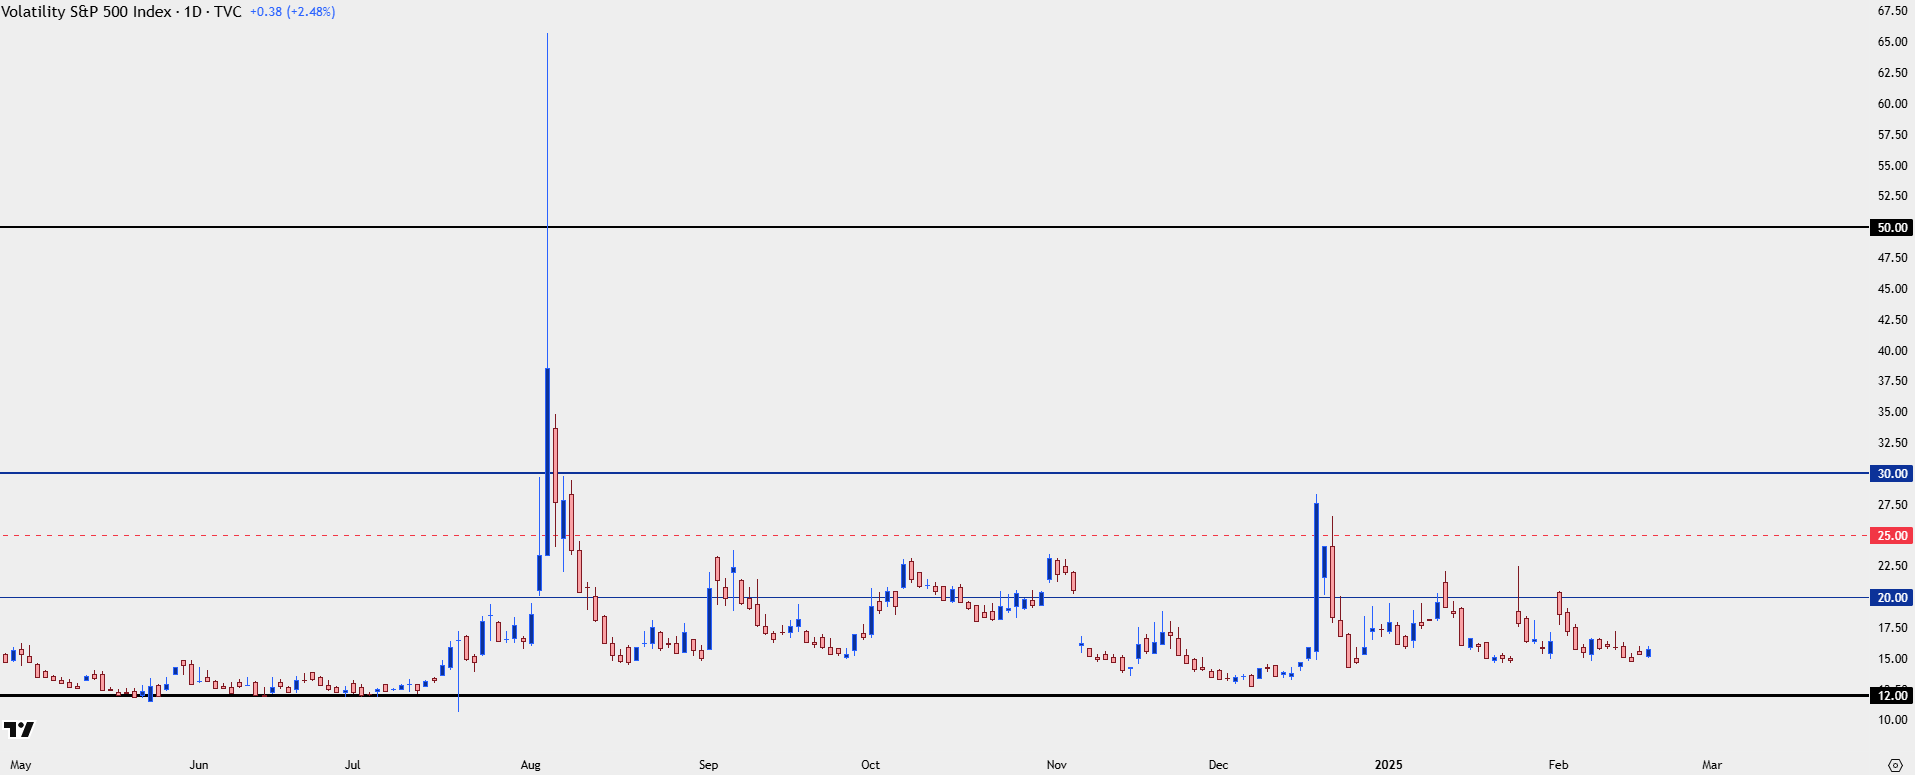 Chart prepared by James Stanley; data derived from Tradingview
S&P 500 Levels
With a backdrop such as we’ve had, chasing moves can be especially dangerous, as we’ve essentially been caught within a band of less than 6% over the past two months, and even tighter, within 4% over the past few weeks. There’s likely quite a few sellers that got caught around lows that are carrying regret, or similarly, bulls that bought breakouts above 6100 that aren’t too happy.
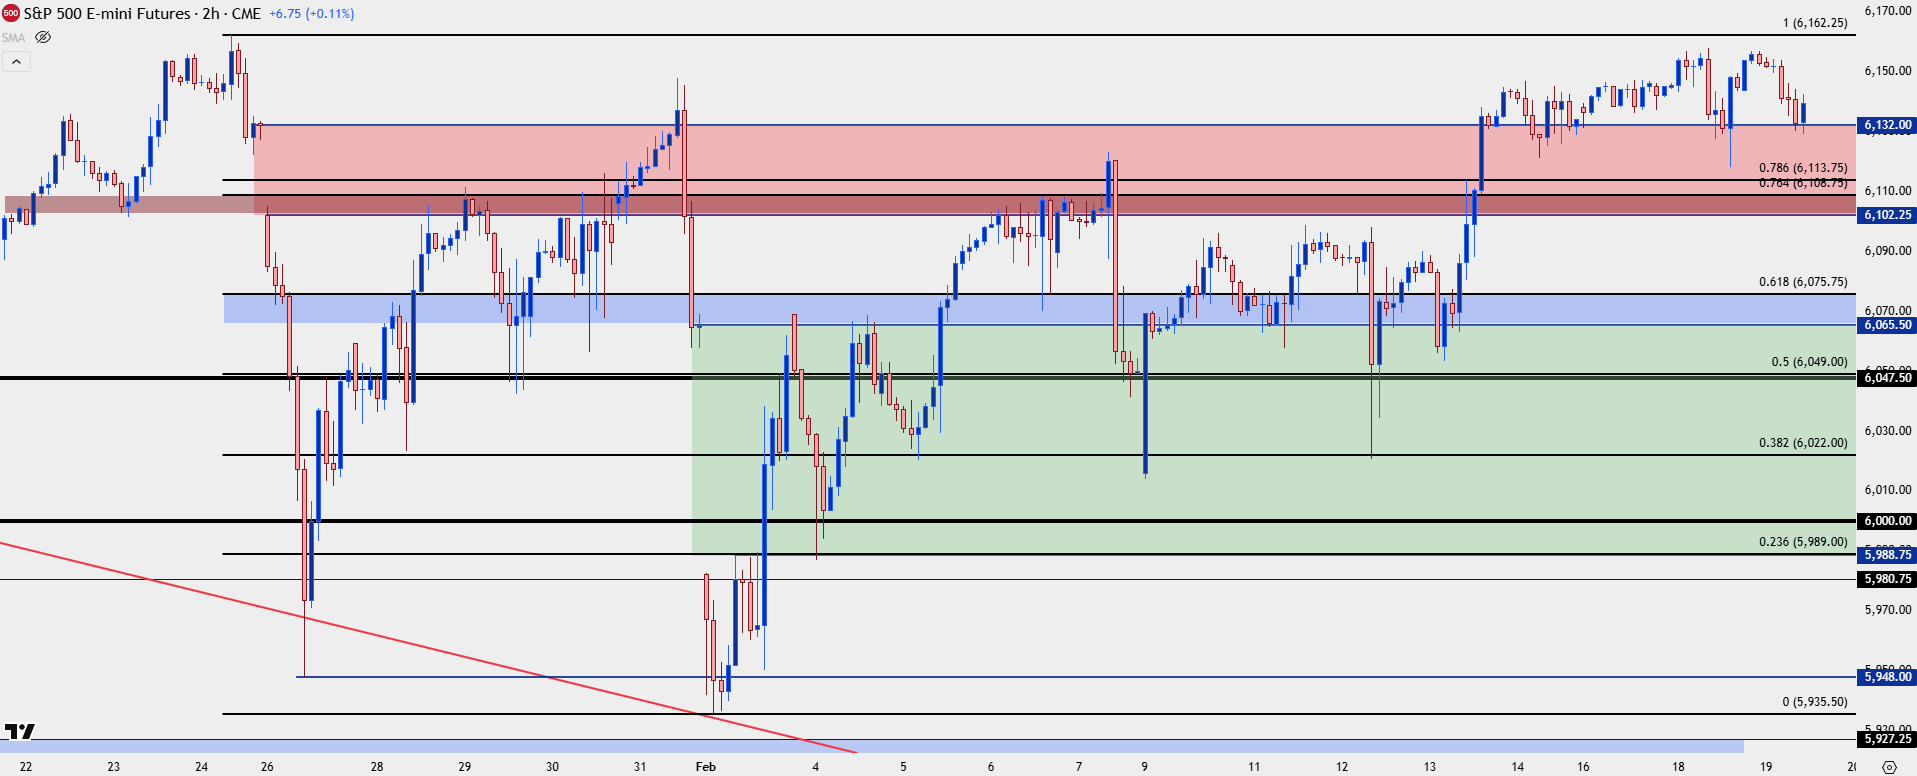
For traders looking to adapt to this environment, with a shorter-term swing approach, they can look to a hold of support to open the door for longs or a hold of resistance to possibly open the door for short-side swings. The Fibonacci retracement produced by the December-February move has shown multiple inflections at key retracement levels, such as the 38.2% marker that caught the lows last Wednesday, or the 23.6% retracement that held the lows the previous Tuesday.
At this point price remains in tight proximity to the ATH and this, again, makes chasing as a challenge. But there is a support that’s been in-play for the past two days around 6132 which is the top of the gap from the DeepSeek sell-off. Below that, at 6108 and 6113 we have the 76.4 and 78.6% Fibonacci retracements, and the latter level held resistance temporarily last Thursday.
S&P 500 Two-Hour Price Chart
--- written by James Stanley, Senior Strategist
S&P 500 Talking Points:
- Volatility has been there for intra-day equity traders of late, but bigger picture it’s been a grind as prices have been within a 3.68% range over the past few weeks and a 5.6% range over the past two months.
- The recent low in stocks coincided with the high in the U.S. Dollar, and if we do see the Dollar sell-off continue, there could be motive for the S&P 500 to finally break the impasse and trade up to a fresh all-time-high.
- I looked at equities as my top trade idea for 2025 and the first zone of support from that has already came into play, which has helped to mark the current 2025 low for the S&P 500. I discussed this in the 2025 Forecast for Equities, as well, which you can access from the link below:
For intra-day traders, there’s been opportunity in equities for this year but for those with a longer-term time frame, they’ve probably been left wanting. In the S&P 500 it’s been tough sledding for bulls at 6150 which is currently working on its third separate test. The first happened just ahead of the December FOMC rate decision, and this is when the Fed started to sound less dovish as they posed their third consecutive rate cut.
That unsettled the mood, to a degree, as the post-election breakout finally started to go into reverse, and that largely held for most of the next month as prices continued to dip into the New Year.
But – support played at the bottom of the election gap. That gap is smaller in S&P 500 futures and wider in the cash market of SPX, which is what I had looked at for the top trade idea of 2025 and the equity forecast for this year. There’s a gap in S&P 500 futures, as well, and I’ve marked that with a red dashed line below. That level helped to mark the low on January 13th and that’s when matters began to turn, in both stocks and the U.S. Dollar.
S&P 500 Futures Daily Price Chart
Chart prepared by James Stanley; data derived from Tradingview
The January 13th Turn
The January 13th turn was important for both stocks and currencies, as that marked both the low in SPX and the high in the U.S. Dollar via DXY. And this harkens back to something I was speaking about since the election, when the post-election run saw U.S. assets running higher in tandem as both the U.S. Dollar and U.S. equities continued to gain, even as Treasury yields were running higher. As I said then, I expected those markets to diverge, at some point, and my expectation was that the Dollar was pullback and equities would break out.
At this point it appears that we may be on the verge of something along those lines. The U.S. Dollar has continued to show a pattern of lower-lows and lower-highs, and as I looked at in yesterday’s webinar, it’s looking more and more like the USD has topped for this cycle.
The risk to that theme, at this point, appears to bear some relation to the equities backdrop as it’s the threat or prospect of tariffs that could both strengthen the USD and weaken equities. We’ve already seen that dynamic at work in early-February.
S&P 500 futures gapped down aggressively as the USD jumped after the weekly open, driven by the threat of tariffs on Canada coming into play. That gap is represented in green on the below chart and notice the higher-highs and lows that’s printed since then, going along with the lower-lows and highs in the USD since that episode.
S&P 500 Futures – Four-Hour Chart
Chart prepared by James Stanley; data derived from Tradingview
The Necessity of Adaptation
As I mentioned in the first line of this article, there’s been opportunity for intra-day traders. It may not have been an easy path, but there’ve been multiple pullbacks in equities that have allowed for establishment of bullish exposure.
The election gap on January 13th was an obvious area and I had looked at that as my ‘s1’ zone for this year. But a couple weeks later, there was a strong gap-down on the back of DeepSeek fears, or the Chinese AI LLM that triggered a host of worries that the AI bubble in the U.S. may soon pop. There was a gap-down on that open but there was also continued selling shortly after the weekly open. But the rest of the week saw recovery until that gap had filled.
And then the next week saw another gap-down, this time on fears of tariffs. But, again, that risk soon dissipated, and bulls pushed the S&P 500 right back up to resistance.
The next week brought even more fears around tariffs but, similarly, bulls jumped on the bid and closed the gap quickly, again, running price back above 6100 in short order.
Notably this hasn’t amounted for any prolonged trends but, again, for intra-day traders there’s been numerous pullback setups. The VIX index remains low, currently reading below 16, and this makes establishment of longer-term exposure a bit more daunting. But it’s the spikes above 20 that have highlighted opportunities of late, as there’s been three such occurrences and each has come along with pullbacks in the S&P 500. This is a factor that could continue to remain of interest.
VIX Daily Chart
Chart prepared by James Stanley; data derived from Tradingview
S&P 500 Levels
With a backdrop such as we’ve had, chasing moves can be especially dangerous, as we’ve essentially been caught within a band of less than 6% over the past two months, and even tighter, within 4% over the past few weeks. There’s likely quite a few sellers that got caught around lows that are carrying regret, or similarly, bulls that bought breakouts above 6100 that aren’t too happy.
For traders looking to adapt to this environment, with a shorter-term swing approach, they can look to a hold of support to open the door for longs or a hold of resistance to possibly open the door for short-side swings. The Fibonacci retracement produced by the December-February move has shown multiple inflections at key retracement levels, such as the 38.2% marker that caught the lows last Wednesday, or the 23.6% retracement that held the lows the previous Tuesday.
At this point price remains in tight proximity to the ATH and this, again, makes chasing as a challenge. But there is a support that’s been in-play for the past two days around 6132 which is the top of the gap from the DeepSeek sell-off. Below that, at 6108 and 6113 we have the 76.4 and 78.6% Fibonacci retracements, and the latter level held resistance temporarily last Thursday.
S&P 500 Two-Hour Price Chart
--- written by James Stanley, Senior Strategist
Related tags:
Latest market news




Open an account in minutes
Experience award-winning platforms with fast and secure execution, and enjoy tight spreads from 0.5 pts on FX and 0.3 pts on indices.
Economic calendar
Web Trader platform
Our sophisticated web-based platform is packed with features.
Related articles
Nasdaq Breakout Potential into Q4 for Melt Up Scenarios
The headlines seem negative in almost any place that you look, with surging Treasury yields and frothy AI valuations getting more and more attention. But, if it’s so bad, why hasn’t the Nasdaq melted down yet, even as the Fed has started hiking rates?
S&P 500 Forecast: SPX rises after cooler-than-expected inflation data
U.S. stocks are rising and Treasury yields are falling after data showed that inflation increased at a cooler pace than expected, while U.S. consumer spending rose again in August.


The RBA Hiked Rates and the Australian Dollar Still Fell
AUD/USD fell after the RBA rate hike because the central bank's hawkish stance was already priced in while the U.S. dollar stayed firm.

This report is intended for general circulation only. It should not be construed as a recommendation, or an offer (or solicitation of an offer) to buy or sell any financial products. The information provided does not take into account your specific investment objectives, financial situation or particular needs. Before you act on any recommendation that may be contained in this report, independent advice ought to be sought from a financial adviser regarding the suitability of the investment product, taking into account your specific investment objectives, financial situation or particular needs.
StoneX Financial Pte. Ltd., may distribute reports produced by its respective foreign entities or affiliates within the StoneX group of companies or third parties pursuant to an arrangement under Regulation 32C of the Financial Advisers Regulations. Where the report is distributed to a person in Singapore who is not an accredited investor, expert investor or an institutional investor (as defined in the Securities Futures Act), StoneX Financial Pte. Ltd. accepts legal responsibility to such persons for the contents of the report only to the extent required by law. Singapore recipients should contact StoneX Financial Pte. Ltd. at 6826 9988 for matters arising from, or in connection with the report.
In the case of all other recipients of this report, to the extent permitted by applicable laws and regulations neither StoneX Financial Pte. Ltd. nor its associated companies will be responsible or liable for any loss or damage incurred arising out of, or in connection with, any use of the information contained in this report and all such liability is hereby expressly disclaimed. No representation or warranty is made, express or implied, that the content of this report is complete or accurate.
StoneX Financial Pte. Ltd. is not under any obligation to update this report.
Trading CFDs carries a high level of risk that may not be suitable for some investors. Consider your investment objectives, level of experience, financial resources, risk appetite and other relevant circumstances carefully. The possibility exists that you could lose some or all of your investments, including your initial deposits. If in doubt, please seek independent expert advice. Visit www.forex.com/en-sg/terms-and-policies for the complete Risk Disclosure Statement.