



Talks of a ceasefire spark US Dollar selloff
With the positive headlines regarding the Russia/Ukraine conflict, the DXY has been selling off and EUR/USD has been bid.
Share this:

Headlines were abundant this morning as Ukrainian and Russian delegates left their first face to face round of talks in nearly two weeks. After entering the meetings Zelensky hoping for a ceasefire, top Russian negotiator Medinsky said that the talks between the 2 sides were constructive and Russia agreed to scale back military operations near Kyiv. Zelensky was willing to say that Ukraine would go to neutral status, without foreign military bases, if a security guarantee is put into place. Possible backers of the security guarantors could be Turkey, Israel, Canada, and Poland according to sources. Ukraine is saying that this is enough of a compromise for a Zelensky and Putin meeting, however this has not been confirmed by either side.
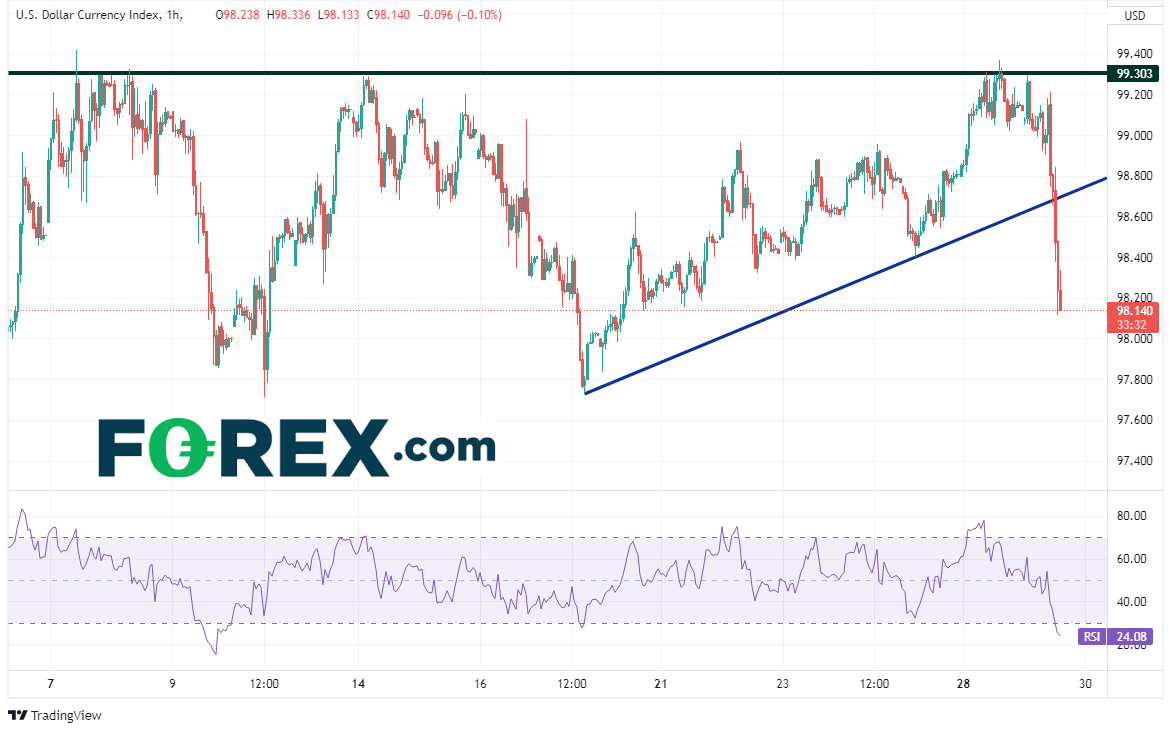
As result of the positive news out of the Russia/Ukraine war, the US Dollar index (DXY) pulled back dramatically. On a 60-minute timeframe, the DXY had been trying to break above 99.30 for days but failed to close above it. With today’s selloff, the US Dollar Index pulled back aggressively and broke below the upward sloping trendline from March 17th.
Source: Tradingview, Stone X
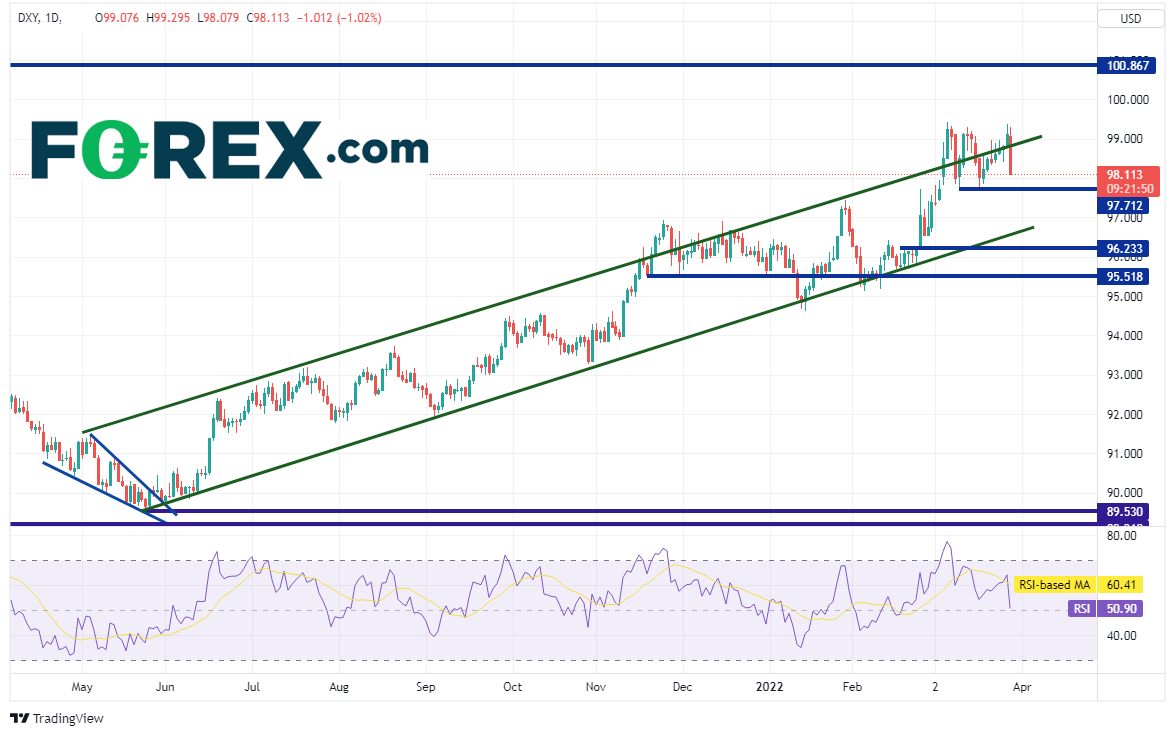
However, as dramatic as the move was on a 60-minute timeframe (over 100 pips), the DXY has been trading in a range between 97.71 and 99.37 since March 4th. Price must break either side of that range for the price move to be meaningful. If the DXY breaks below 97.71, the next support level is the bottom trendline of the upward sloping channel that the pair has been in since May 2021, near 96.60, then horizontal support at 96.23. If price reverses and shrugs off this move lower, resistance above 99.37 isn’t until the highs from April 2020 near 100.87.
Source: Tradingview, Stone X
As the Euro makes up 57.6% of the US Dollar Index, one could expect that EUR/USD would move opposite the DXY. On the 60-minute timeframe, EUR/USD broke above the downward sloping trendline dating back to February 25th and is attempting to take out horizontal resistance at 1.1143, the highs of the range dating back to March 2nd.

Source: Tradingview, Stone X
On a daily timeframe, notice that the top, downward sloping trendline of the channel crosses just above the horizontal resistance at 1.1165. Above there is horizontal resistance at 1.1280 and again near 1.1500. Support is at the lows from Monday at 1.0945, then the low from March 7th at 1.0813.

Source: Tradingview, Stone X
With the positive headlines regarding the Russia/Ukraine conflict, the DXY has been selling off and EUR/USD has been bid. However, keep a close eye on the headlines. Any sign of negative news and the currency pairs can reverse quickly.
Headlines were abundant this morning as Ukrainian and Russian delegates left their first face to face round of talks in nearly two weeks. After entering the meetings Zelensky hoping for a ceasefire, top Russian negotiator Medinsky said that the talks between the 2 sides were constructive and Russia agreed to scale back military operations near Kyiv. Zelensky was willing to say that Ukraine would go to neutral status, without foreign military bases, if a security guarantee is put into place. Possible backers of the security guarantors could be Turkey, Israel, Canada, and Poland according to sources. Ukraine is saying that this is enough of a compromise for a Zelensky and Putin meeting, however this has not been confirmed by either side.
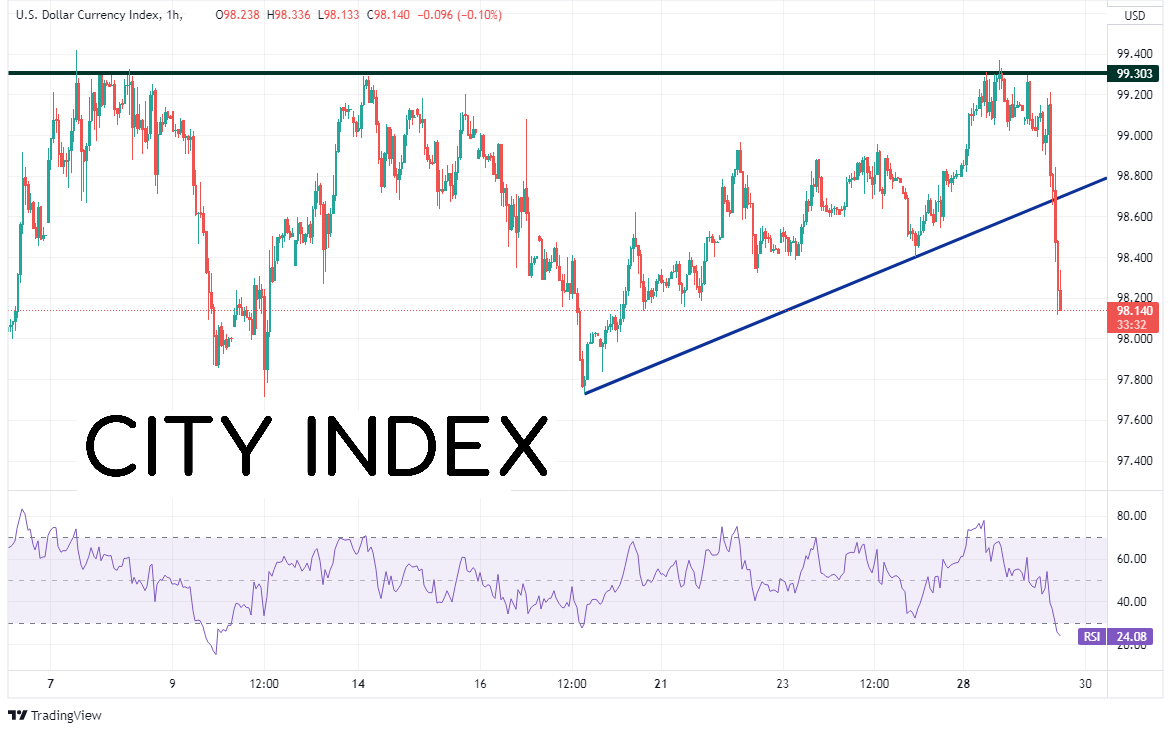
As result of the positive news out of the Russia/Ukraine war, the US Dollar index (DXY) pulled back dramatically. On a 60-minute timeframe, the DXY had been trying to break above 99.30 for days but failed to close above it. With today’s selloff, the US Dollar Index pulled back aggressively and broke below the upward sloping trendline from March 17th.
Source: Tradingview, Stone X
Trade DXY now: Login or Open a new account!
• Open an account in the UK
• Open an account in Australia
• Open an account in Singapore
However, as dramatic as the move was on a 60-minute timeframe (over 100 pips), the DXY has been trading in a range between 97.71 and 99.37 since March 4th. Price must break either side of that range for the price move to be meaningful. If the DXY breaks below 97.71, the next support level is the bottom trendline of the upward sloping channel that the pair has been in since May 2021, near 96.60, then horizontal support at 96.23. If price reverses and shrugs off this move lower, resistance above 99.37 isn’t until the highs from April 2020 near 100.87.

Source: Tradingview, Stone X
As the Euro makes up 57.6% of the US Dollar Index, one could expect that EUR/USD would move opposite the DXY. On the 60-minute timeframe, EUR/USD broke above the downward sloping trendline dating back to February 25th and is attempting to take out horizontal resistance at 1.1143, the highs of the range dating back to March 2nd.

Source: Tradingview, Stone X
Trade EUR/USD now: Login or Open a new account!
• Open an account in the UK
• Open an account in Australia
• Open an account in Singapore
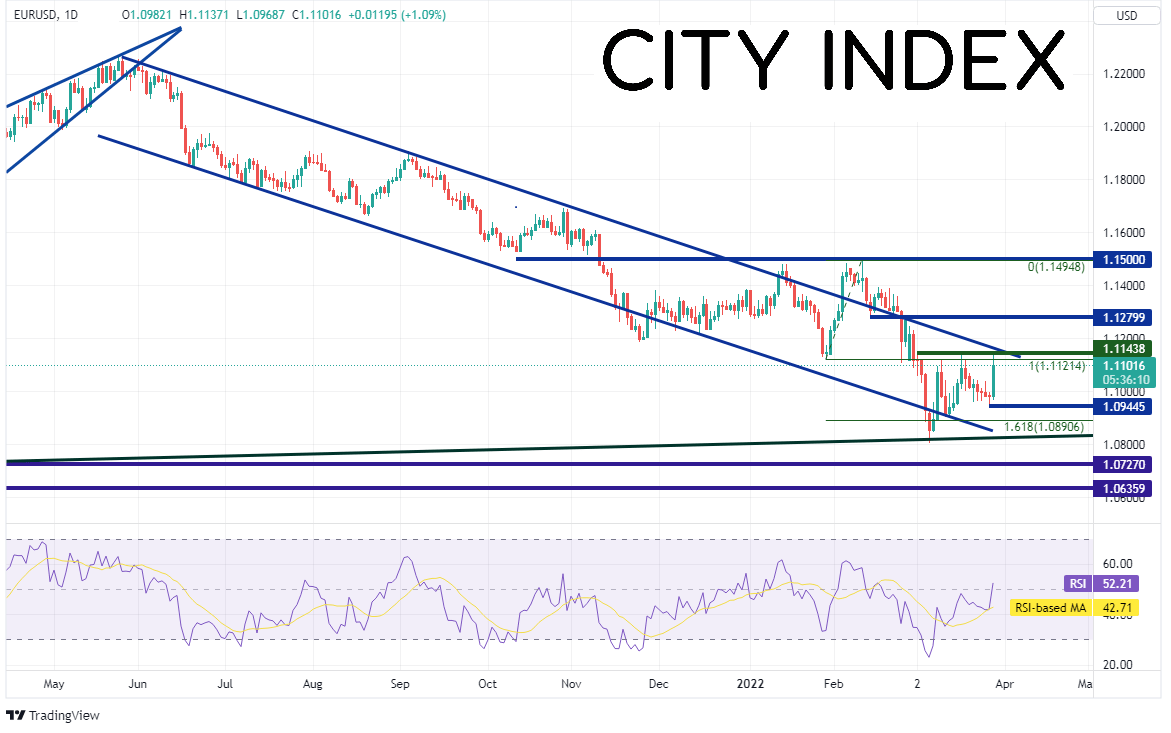
On a daily timeframe, notice that the top, downward sloping trendline of the channel crosses just above the horizontal resistance at 1.1165. Above there is horizontal resistance at 1.1280 and again near 1.1500. Support is at the lows from Monday at 1.0945, then the low from March 7th at 1.0813.
Source: Tradingview, Stone X
With the positive headlines regarding the Russia/Ukraine conflict, the DXY has been selling off and EUR/USD has been bid. However, keep a close eye on the headlines. Any sign of negative news and the currency pairs can reverse quickly.
Learn more about forex trading opportunities.
Related tags:
Latest market news




Open an account in minutes
Experience award-winning platforms with fast and secure execution, and enjoy tight spreads from 0.5 pts on FX and 0.3 pts on indices.
Economic calendar
Web Trader platform
Our sophisticated web-based platform is packed with features.
Related articles
US Core PCE Preview: Stale or Significant for the Fed
Core PCE inflation takes center stage Wednesday, with traders watching for signs of renewed price pressure and clues on whether the Fed could hike again in October.
Australian Dollar Forecast: AUD/USD Four-Week Slide Nears Critical Uptrend Support 9 29 2026
Aussie momentum has deteriorated sharply into quarter-end, with inflation, Core PCE and NFP on tap as AUD/USD closes in on a pivotal technical threshold.

Euro Forecast: EUR/USD Tumbles Towards Yearly Low as Daily RSI Goes Oversold
EUR/USD has been hit hard in the final month of the quarter as USD strength has shown up in a big way. With the pair set to challenge its yearly low as RSI has pushed into oversold territory, is there a chance for a pullback with some big headline risk hitting in the US over the next few days?

This report is intended for general circulation only. It should not be construed as a recommendation, or an offer (or solicitation of an offer) to buy or sell any financial products. The information provided does not take into account your specific investment objectives, financial situation or particular needs. Before you act on any recommendation that may be contained in this report, independent advice ought to be sought from a financial adviser regarding the suitability of the investment product, taking into account your specific investment objectives, financial situation or particular needs.
StoneX Financial Pte. Ltd., may distribute reports produced by its respective foreign entities or affiliates within the StoneX group of companies or third parties pursuant to an arrangement under Regulation 32C of the Financial Advisers Regulations. Where the report is distributed to a person in Singapore who is not an accredited investor, expert investor or an institutional investor (as defined in the Securities Futures Act), StoneX Financial Pte. Ltd. accepts legal responsibility to such persons for the contents of the report only to the extent required by law. Singapore recipients should contact StoneX Financial Pte. Ltd. at 6826 9988 for matters arising from, or in connection with the report.
In the case of all other recipients of this report, to the extent permitted by applicable laws and regulations neither StoneX Financial Pte. Ltd. nor its associated companies will be responsible or liable for any loss or damage incurred arising out of, or in connection with, any use of the information contained in this report and all such liability is hereby expressly disclaimed. No representation or warranty is made, express or implied, that the content of this report is complete or accurate.
StoneX Financial Pte. Ltd. is not under any obligation to update this report.
Trading CFDs carries a high level of risk that may not be suitable for some investors. Consider your investment objectives, level of experience, financial resources, risk appetite and other relevant circumstances carefully. The possibility exists that you could lose some or all of your investments, including your initial deposits. If in doubt, please seek independent expert advice. Visit www.forex.com/en-sg/terms-and-policies for the complete Risk Disclosure Statement.