




Tech Earnings, Overbought Momentum Challenge Nasdaq & Silver Records
Both silver and the Nasdaq are outperforming historically in 2025, yet silver’s $40 psychological ceiling and the Nasdaq’s 23,500 resistance may temporarily stall further gains as markets brace for key tech earnings and the FOMC meeting this week.
Share this:

Key Events to Watch This Week:
- Leading US Economic Indicators: US Advance GDP and FOMC (Wednesday), US Core PCE (Thursday), US NFP (Friday), US ISM PMI (Friday)
- Tech Earnings and Market Sentiment: Microsoft and Meta (Wednesday); Apple and Amazon (Thursday)
- Nasdaq at All-Time Highs, Silver Pulling Back from Decade Highs: Ahead of FOMC decisions and mega-cap tech earnings
From a fundamental standpoint, the strength seen in both tech and silver markets in 2025 may be supported by the structural integration of AI and innovation into global economic agendas. As AI and technology increasingly become the backbone of global infrastructure and development, demand is likely to remain strong.
This backdrop may sustain the broader uptrend across Nasdaq, as a proxy for tech and innovation-driven equities, and silver, given its critical use in tech-related industrial production—both eyeing sustainable record highs.
Key Earnings Estimates:
- Microsoft: $73.79B expected
- Meta: $44.72B expected
- Apple: $89B expected
- Amazon: $169.05B expected
Technical Analysis: Quantifying Uncertainties
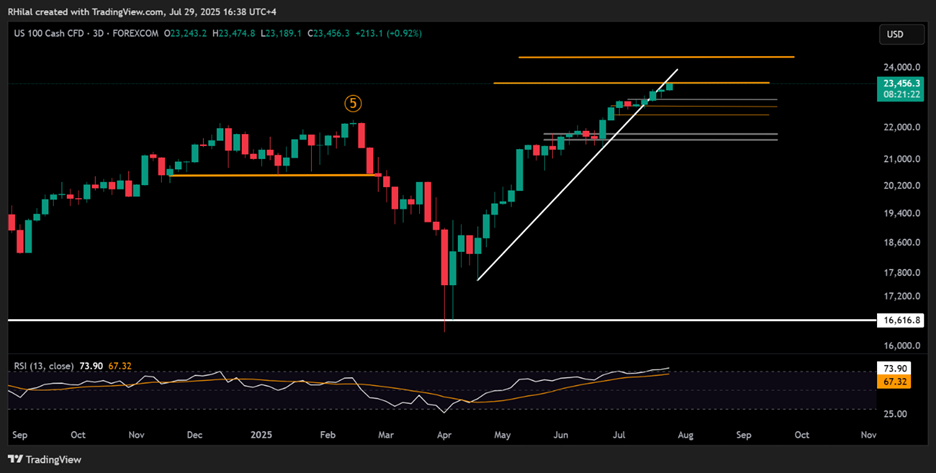
Nasdaq Outlook – 3-Day Time Frame – Log Scale
Source: TradingView
Nasdaq is currently holding its bullish momentum at the 23,500 resistance, a key level that coincides with the 0.618 Fibonacci extension drawn from the October 2022 low (10,432), February 2025 high (22,245), and 2025 trough (16,324).
- Bullish Scenario: A sustained break above 23,500 may extend the rally toward 24,300 and 25,500.
- Bearish/Neutral Scenario: A failure to hold above 23,500 could trigger a consolidation or correction toward 23,000, 22,700, and 22,400 before resuming the broader uptrend—or possibly confirming a deeper downturn.
Silver Outlook – Weekly Time Frame – Log Scale

Source: Tradingview
Silver is currently retreating from the $40 psychological zone, the 39.50 high, which aligns with the target of an inverted head and shoulders pattern formed between August 2020 and March 2024.
- Pullback Scenario: In line with weekly overbought momentum as per the RSI indicator, a retracement may target support levels at $37, $36.20, and $35.20 before resuming its broader bullish trend.
- Breakout Scenario: A confirmed close above $40 may open the door to $42, $46, and potentially a move beyond $50.
Written by Razan Hilal, CMT
Follow on X: @Rh_waves
Related tags:




Open an account in minutes
Experience award-winning platforms with fast and secure execution, and enjoy tight spreads from 0.5 pts on FX and 0.3 pts on indices.
Economic calendar
Web Trader platform
Our sophisticated web-based platform is packed with features.
Related articles

Gold, silver slammed as hawkish Fed repricing reignites dollar upside
Gold and silver had held up surprisingly well against surging US yields. Wednesday’s DXY breakout may have changed that equation.


EUR/USD, Nasdaq Price Outlook: Reversal Risks Build
EUR/USD and Nasdaq Price Outlook: Overbought/oversold momentum on hourly and daily time frames is raising reversal risks across the U.S. dollar, EUR/USD and Nasdaq after a strong weekly advance.

Nasdaq 100 Forecast: NDX rises further with Middle East developments in focus
U.S. stocks are heading for a modestly stronger start as investors awaited developments over potential talks between the U.S. and Iran.

This report is intended for general circulation only. It should not be construed as a recommendation, or an offer (or solicitation of an offer) to buy or sell any financial products. The information provided does not take into account your specific investment objectives, financial situation or particular needs. Before you act on any recommendation that may be contained in this report, independent advice ought to be sought from a financial adviser regarding the suitability of the investment product, taking into account your specific investment objectives, financial situation or particular needs.
StoneX Financial Pte. Ltd., may distribute reports produced by its respective foreign entities or affiliates within the StoneX group of companies or third parties pursuant to an arrangement under Regulation 32C of the Financial Advisers Regulations. Where the report is distributed to a person in Singapore who is not an accredited investor, expert investor or an institutional investor (as defined in the Securities Futures Act), StoneX Financial Pte. Ltd. accepts legal responsibility to such persons for the contents of the report only to the extent required by law. Singapore recipients should contact StoneX Financial Pte. Ltd. at 6826 9988 for matters arising from, or in connection with the report.
In the case of all other recipients of this report, to the extent permitted by applicable laws and regulations neither StoneX Financial Pte. Ltd. nor its associated companies will be responsible or liable for any loss or damage incurred arising out of, or in connection with, any use of the information contained in this report and all such liability is hereby expressly disclaimed. No representation or warranty is made, express or implied, that the content of this report is complete or accurate.
StoneX Financial Pte. Ltd. is not under any obligation to update this report.
Trading CFDs carries a high level of risk that may not be suitable for some investors. Consider your investment objectives, level of experience, financial resources, risk appetite and other relevant circumstances carefully. The possibility exists that you could lose some or all of your investments, including your initial deposits. If in doubt, please seek independent expert advice. Visit www.forex.com/en-sg/terms-and-policies for the complete Risk Disclosure Statement.