






Trump Announces Reciprocal Tariffs, USD Tests Support
Trump announced sweeping reciprocal tariffs, but they appear to be delayed in implementation, allowing for time to negotiate; and that’s released some pressure from markets fearing even more near-term change.
Share this:

Trump Tariff, US Dollar Talking Points:
- President Trump has announced reciprocal tariffs, saying “whatever they charge us we will charge them.” He also said that the US will consider countries using a VAT tax as a tariff for reciprocal tariffs, which would apply to Europe. And Trump has also said that a tariff on automobiles are coming soon, which will be stacked on top of reciprocal tariffs.
- Earlier in the day, the Dollar was dashed on media reports that tariffs wouldn’t be implemented until April 1st, but famously Trump has walked back similar reports multiple times. So, caution is still warranted into the end of the week.
- The fact that the Dollar didn’t rally more on the reciprocal tariff announcement implies that markets are expecting President Trump to use this as a negotiation chip rather than wanting to implement tariffs anytime soon. But he’s shown a penchant for Friday announcements that can lead to weekend anxiety and gaps-down the following week, on top of weekend commentary on the topic such as when he first mentioned the idea of tariffs on Europe.
DXY is back to 107.35 and so far, that’s held the daily low for today. The backdrop around tariffs remains opaque, as I looked at in the above video, and this will likely remain as a driving factor in FX markets, which could have related implications elsewhere like commodities and equities.
From the weekly chart of DXY, we can see how important that level has been, holding support for now the fourth consecutive week in DXY. Notably, Trump has had quite a bit to say on Fridays of late and given today’s announcement around reciprocal tariffs, that potential remains. If he does highlight a possibly earlier start date, particularly for Europe, there could be a USD-strength impact to appear.
U.S. Dollar Weekly Price Chart

Chart prepared by James Stanley; data derived from Tradingview
USD Shorter-Term
To say that this is a volatile situation would appear an understatement. As I discussed in this week’s webinar the dominance of headlines and the tariff topic have seemed to eclipse strong U.S. inflation data, to the point that the U.S. Dollar has shown weakness even with markets pricing out rate cuts for later this year.
It’s been a busy couple of days, and I’ve recapped some of the larger events on the below 30-minute chart of DXY.
U.S. Dollar 30-Minute Chart
 Chart prepared by James Stanley; data derived from Tradingview
EUR/USD
When I looked at the Euro yesterday I highlighted the shorter-term bullish bias in the pair as there’s been a penchant for sellers to dry up below the 1.0300 handle. So far this week it’s been another failed run from bears and the pair is now testing a fresh two-week-high.
As I looked at in the webinar, chasing could be a challenge here – but pullbacks and responses to higher-low support could be an opening for USD-weakness setups. The next level overhead is the 1.0457 Fibonacci level, and for support, the prior resistance at the confluent 1.0407 zone looms large. For next resistance, above the 1.0500 handle is the 1.0533 Fibonacci level that set the January high.
EUR/USD Daily Price Chart
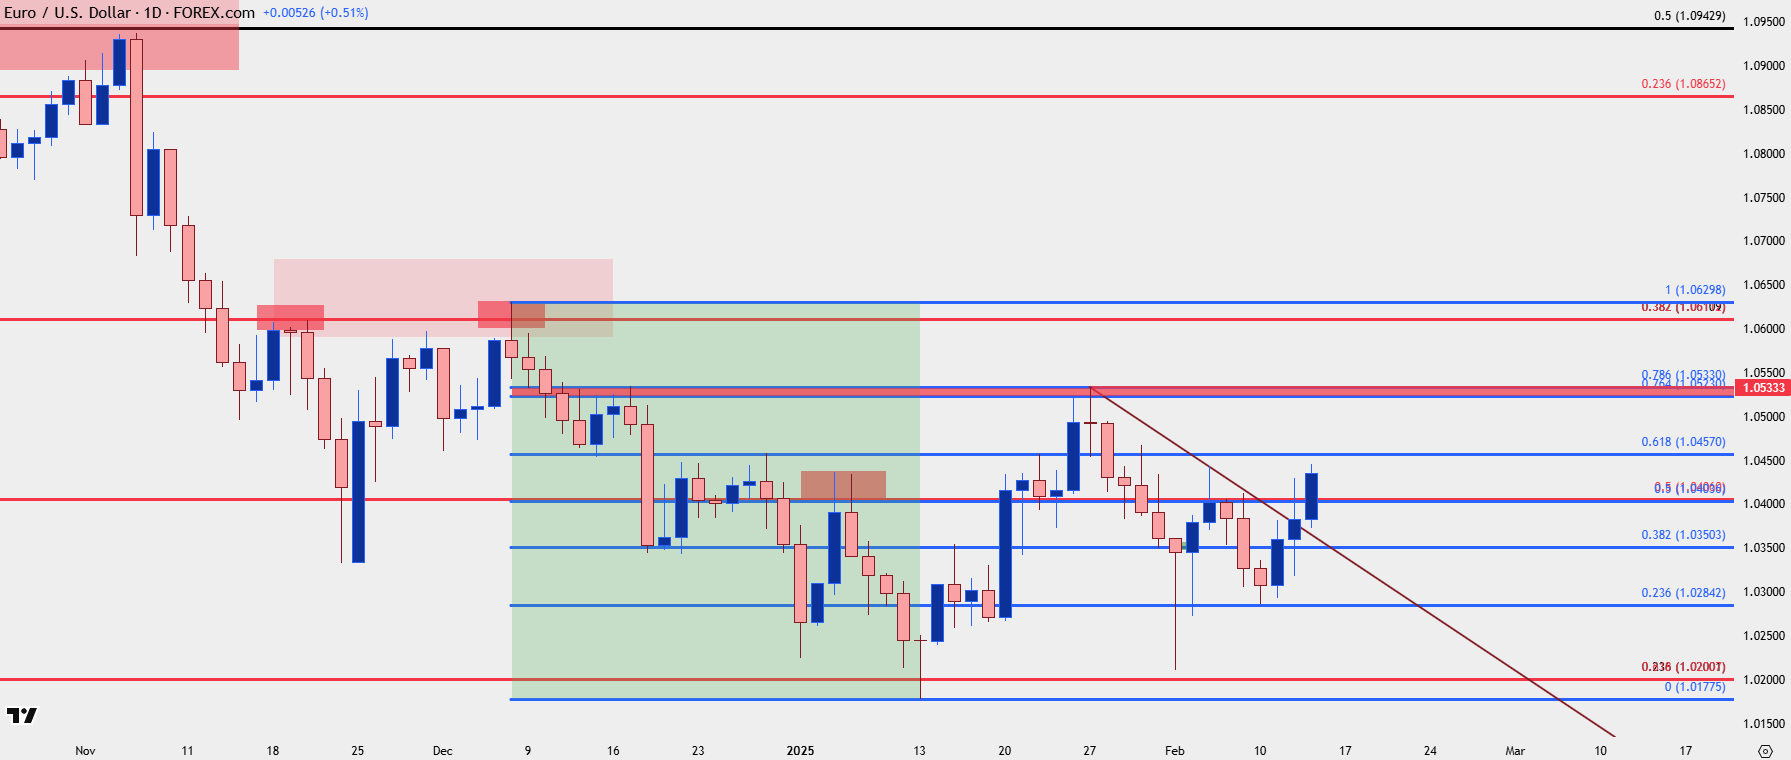 Chart prepared by James Stanley; data derived from Tradingview
--- written by James Stanley, Senior Strategist
Trump Tariff, US Dollar Talking Points:
- President Trump has announced reciprocal tariffs, saying “whatever they charge us we will charge them.” He also said that the US will consider countries using a VAT tax as a tariff for reciprocal tariffs, which would apply to Europe. And Trump has also said that a tariff on automobiles are coming soon, which will be stacked on top of reciprocal tariffs.
- Earlier in the day, the Dollar was dashed on media reports that tariffs wouldn’t be implemented until April 1st, but famously Trump has walked back similar reports multiple times. So, caution is still warranted into the end of the week.
- The fact that the Dollar didn’t rally more on the reciprocal tariff announcement implies that markets are expecting President Trump to use this as a negotiation chip rather than wanting to implement tariffs anytime soon. But he’s shown a penchant for Friday announcements that can lead to weekend anxiety and gaps-down the following week, on top of weekend commentary on the topic such as when he first mentioned the idea of tariffs on Europe.
DXY is back to 107.35 and so far, that’s held the daily low for today. The backdrop around tariffs remains opaque, as I looked at in the above video, and this will likely remain as a driving factor in FX markets, which could have related implications elsewhere like commodities and equities.
From the weekly chart of DXY, we can see how important that level has been, holding support for now the fourth consecutive week in DXY. Notably, Trump has had quite a bit to say on Fridays of late and given today’s announcement around reciprocal tariffs, that potential remains. If he does highlight a possibly earlier start date, particularly for Europe, there could be a USD-strength impact to appear.
U.S. Dollar Weekly Price Chart
Chart prepared by James Stanley; data derived from Tradingview
USD Shorter-Term
To say that this is a volatile situation would appear an understatement. As I discussed in this week’s webinar the dominance of headlines and the tariff topic have seemed to eclipse strong U.S. inflation data, to the point that the U.S. Dollar has shown weakness even with markets pricing out rate cuts for later this year.
It’s been a busy couple of days, and I’ve recapped some of the larger events on the below 30-minute chart of DXY.
U.S. Dollar 30-Minute Chart
Chart prepared by James Stanley; data derived from Tradingview
EUR/USD
When I looked at the Euro yesterday I highlighted the shorter-term bullish bias in the pair as there’s been a penchant for sellers to dry up below the 1.0300 handle. So far this week it’s been another failed run from bears and the pair is now testing a fresh two-week-high.
As I looked at in the webinar, chasing could be a challenge here – but pullbacks and responses to higher-low support could be an opening for USD-weakness setups. The next level overhead is the 1.0457 Fibonacci level, and for support, the prior resistance at the confluent 1.0407 zone looms large. For next resistance, above the 1.0500 handle is the 1.0533 Fibonacci level that set the January high.
EUR/USD Daily Price Chart
Chart prepared by James Stanley; data derived from Tradingview
--- written by James Stanley, Senior Strategist

Open an account in minutes
Experience award-winning platforms with fast and secure execution, and enjoy tight spreads from 0.5 pts on FX and 0.3 pts on indices.
Economic calendar
Web Trader platform
Our sophisticated web-based platform is packed with features.
Related articles

USD into a Massive Week as Yields Fly and Gold Breaks
It’s a huge week with PCE and NFP, but it’s what’s happening off of the calendar that demands attention with US yields flying to fresh multi-decade highs.

USDJPY Forecast Intervention Fears Clash with Dollar Strength
Recent trading sessions have produced mixed results for the Japanese yen. By the end of last week, USD/JPY had fallen by more than 1.00%, reflecting a modest recovery in the yen. However, the start of this week has seen the pair move slightly back in favor of the U.S. dollar, posting gains of around 0.04%.


Nasdaq 100 Forecast: NDX falls as oil jumps and Treasury yields rise
U.S. stocks are pointing to a weaker open on Monday after President Trump rejected an Iranian ceasefire, sending oil prices higher and fuelling inflationary concerns and pushing Treasury yields higher.

This report is intended for general circulation only. It should not be construed as a recommendation, or an offer (or solicitation of an offer) to buy or sell any financial products. The information provided does not take into account your specific investment objectives, financial situation or particular needs. Before you act on any recommendation that may be contained in this report, independent advice ought to be sought from a financial adviser regarding the suitability of the investment product, taking into account your specific investment objectives, financial situation or particular needs.
StoneX Financial Pte. Ltd., may distribute reports produced by its respective foreign entities or affiliates within the StoneX group of companies or third parties pursuant to an arrangement under Regulation 32C of the Financial Advisers Regulations. Where the report is distributed to a person in Singapore who is not an accredited investor, expert investor or an institutional investor (as defined in the Securities Futures Act), StoneX Financial Pte. Ltd. accepts legal responsibility to such persons for the contents of the report only to the extent required by law. Singapore recipients should contact StoneX Financial Pte. Ltd. at 6826 9988 for matters arising from, or in connection with the report.
In the case of all other recipients of this report, to the extent permitted by applicable laws and regulations neither StoneX Financial Pte. Ltd. nor its associated companies will be responsible or liable for any loss or damage incurred arising out of, or in connection with, any use of the information contained in this report and all such liability is hereby expressly disclaimed. No representation or warranty is made, express or implied, that the content of this report is complete or accurate.
StoneX Financial Pte. Ltd. is not under any obligation to update this report.
Trading CFDs carries a high level of risk that may not be suitable for some investors. Consider your investment objectives, level of experience, financial resources, risk appetite and other relevant circumstances carefully. The possibility exists that you could lose some or all of your investments, including your initial deposits. If in doubt, please seek independent expert advice. Visit www.forex.com/en-sg/terms-and-policies for the complete Risk Disclosure Statement.