



US Data Dump dominates central banks
With Thursday’s poor economic data and the Fed still hiking rates (albeit at a slower pace), a recession may be in the cards for the US!
Share this:

On Wednesday, the FOMC hiked rates by 50bps to 4.5% and said that it will not begin to lower rates until they are sufficiently restrictive and the FOMC is confident inflation is moving towards 2%. Market movement was relatively small for a hawkish FOMC. On Thursday, the Bank of England hiked rates 50bps as well to bring its borrowing rate to 3.5%. BOE Governor Bailey said that the MPC’s latest projections suggest CPI has reached its peak, however it is expected to remain “very high” in the coming months. As a result, forward guidance suggests more hikes will follow. The ECB also hiked 50bps to raise its deposit rate to 2.0%. During the press conference that followed, ECB President Christine Lagarde said that it’s “obvious that we should expect 50bps hikes for a period of time”. EUR/USD went bid by 100 pips!
US stocks had been moving lower overnight and the US Dollar had been going bid. The US Dollar Index moved aggressively lower before the US stock open as EUR/USD spiked higher on Christine Lagarde’s comments. However, it wasn’t until the US stock market open that stocks picked up steam to the downside and the DXY regained an aggressive bid. The reason for the dramatic moves after the US stock market open had more to do with the US data dump than it did the central bank meetings.
Today’s US data release showed that a recession may be brewing in the US (while the Fed is still threatening to increase interest rates). US Retail Sales for November were -0.6% MoM vs an expectation of -0.1% MoM and an October reading of +1.3% MoM. This was the largest drop since December 2021. Retail Sales Ex-Autos was -0.2% MoM vs +0.2% MoM expected and +1.2% in November. This was also the largest drop since December 2021. Looking at the first of the Federal Reserve’s regional Manufacturing Indexes, the Philadelphia Fed Manufacturing Index was -13.8 vs an expectation of -10 and a November reading of -19.4. The Employment, New Orders, and Prices Paid components were all lower than the previous month. In addition, the NY Empire State Manufacturing Index fell to -11.2 vs and expectation of -1 and a prior reading of 4.5. This was the steepest contraction since August. Industrial Production for November was -0.2% MoM vs an expectation of +0.1% MoM and a previous reading of -0.1% MoM. Manufacturing Production was -0.6% MoM vs an expectation of -0.1% and a prior reading of +0.3% MoM.
All the US data releases on Thursday were all weaker than expected. In the recent past, markets may have viewed this as a positive for the markets, hoping it would slow down the Feds pace of rate increases. However, with the dot plots showing a 5.1% terminal interest rate, the Fed says it still has some work to do hiking rates.
Below is a 15-minute chart of the US Dollar Index (DXY). Notice that when the US stock market opened, the DXY took off after US stocks began to plummet. The EUR/USD move on the hawkish Christine Lagarde comments was completely reversed within an hour.

Source: Tradingview, Stone X
Check out EUR/USD as well:

Source: Tradingview, Stone X
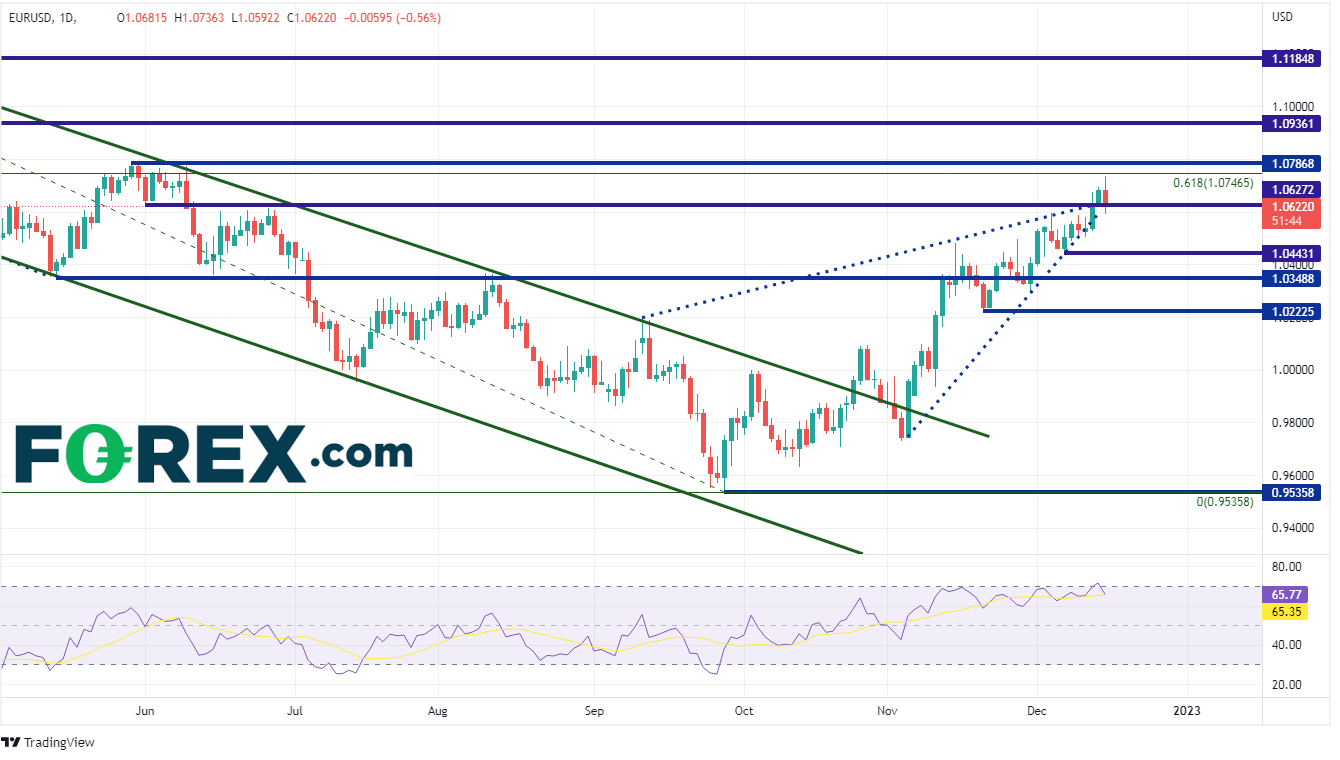
EUR/USD has been moving higher since making lows on September 28th at 0.9536. The pair has been moving in an ascending wedge formation. Price reached the apex but continued to move higher. Today, EUR/USD stalled at the 61.8% Fibonacci retracement level from the highs of the year in February to the lows of the year in September near 1.0747. Today’s candlestick was also a bearish engulfing pattern, suggesting more downside to come. First support is at the lows of December 7th at 1.0455. Below there, price can fall to long-term support between 1.0349 and 1.0366. The next level of support is at the lows from November 21st near 1.0223. However, if EUR/USD continues higher, first resistance is at the previously mentioned 61.8% Fibonacci retracement level of 1.0747, then horizontal resistance at 1.0787 and 1.0936.
Source: Tradingview, Stone X
Is a recession ahead for the US? It will take time to find out. However, with Thursday’s poor economic data and the Fed still hiking rates (albeit at a slower pace), a recession may be in the cards for the US!
On Wednesday, the FOMC hiked rates by 50bps to 4.5% and said that it will not begin to lower rates until they are sufficiently restrictive and the FOMC is confident inflation is moving towards 2%. Market movement was relatively small for a hawkish FOMC. On Thursday, the Bank of England hiked rates 50bps as well to bring its borrowing rate to 3.5%. BOE Governor Bailey said that the MPC’s latest projections suggest CPI has reached its peak, however it is expected to remain “very high” in the coming months. As a result, forward guidance suggests more hikes will follow. The ECB also hiked 50bps to raise its deposit rate to 2.0%. During the press conference that followed, ECB President Christine Lagarde said that it’s “obvious that we should expect 50bps hikes for a period of time”. EUR/USD went bid by 100 pips!
US stocks had been moving lower overnight and the US Dollar had been going bid. The US Dollar Index moved aggressively lower before the US stock open as EUR/USD spiked higher on Christine Lagarde’s comments. However, it wasn’t until the US stock market open that stocks picked up steam to the downside and the DXY regained an aggressive bid. The reason for the dramatic moves after the US stock market open had more to do with the US data dump than it did the central bank meetings.
Today’s US data release showed that a recession may be brewing in the US (while the Fed is still threatening to increase interest rates). US Retail Sales for November were -0.6% MoM vs an expectation of -0.1% MoM and an October reading of +1.3% MoM. This was the largest drop since December 2021. Retail Sales Ex-Autos was -0.2% MoM vs +0.2% MoM expected and +1.2% in November. This was also the largest drop since December 2021. Looking at the first of the Federal Reserve’s regional Manufacturing Indexes, the Philadelphia Fed Manufacturing Index was -13.8 vs an expectation of -10 and a November reading of -19.4. The Employment, New Orders, and Prices Paid components were all lower than the previous month. In addition, the NY Empire State Manufacturing Index fell to -11.2 vs and expectation of -1 and a prior reading of 4.5. This was the steepest contraction since August. Industrial Production for November was -0.2% MoM vs an expectation of +0.1% MoM and a previous reading of -0.1% MoM. Manufacturing Production was -0.6% MoM vs an expectation of -0.1% and a prior reading of +0.3% MoM.
All the US data releases on Thursday were all weaker than expected. In the recent past, markets may have viewed this as a positive for the markets, hoping it would slow down the Feds pace of rate increases. However, with the dot plots showing a 5.1% terminal interest rate, the Fed says it still has some work to do hiking rates.
Below is a 15-minute chart of the US Dollar Index (DXY). Notice that when the US stock market opened, the DXY took off after US stocks began to plummet. The EUR/USD move on the hawkish Christine Lagarde comments was completely reversed within an hour.

Source: Tradingview, Stone X
Trade the DXY now: Login or Open a new account!
• Open an account in the UK
• Open an account in Australia
• Open an account in Singapore
Check out EUR/USD as well:

Source: Tradingview, Stone X
EUR/USD has been moving higher since making lows on September 28th at 0.9536. The pair has been moving in an ascending wedge formation. Price reached the apex but continued to move higher. Today, EUR/USD stalled at the 61.8% Fibonacci retracement level from the highs of the year in February to the lows of the year in September near 1.0747. Today’s candlestick was also a bearish engulfing pattern, suggesting more downside to come. First support is at the lows of December 7th at 1.0455. Below there, price can fall to long-term support between 1.0349 and 1.0366. The next level of support is at the lows from November 21st near 1.0223. However, if EUR/USD continues higher, first resistance is at the previously mentioned 61.8% Fibonacci retracement level of 1.0747, then horizontal resistance at 1.0787 and 1.0936.

Source: Tradingview, Stone X
Trade EUR/USD now: Login or Open a new account!
• Open an account in the UK
• Open an account in Australia
• Open an account in Singapore
Is a recession ahead for the US? It will take time to find out. However, with Thursday’s poor economic data and the Fed still hiking rates (albeit at a slower pace), a recession may be in the cards for the US!
Learn more about forex trading opportunities.
Related tags:

Open an account in minutes
Experience award-winning platforms with fast and secure execution, and enjoy tight spreads from 0.5 pts on FX and 0.3 pts on indices.
Economic calendar
Web Trader platform
Our sophisticated web-based platform is packed with features.
Related articles

NZD/USD pressure mounts as payrolls looms large
NZD/USD has fallen sharply as Fed rate expectations reset higher, but extreme downside stretch and major support raise the risk of a violent counter-trend rebound.


US Core PCE Preview: Stale or Significant for the Fed
Core PCE inflation takes center stage Wednesday, with traders watching for signs of renewed price pressure and clues on whether the Fed could hike again in October.


Australian Dollar Forecast: AUD/USD Four-Week Slide Nears Critical Uptrend Support 9 29 2026
Aussie momentum has deteriorated sharply into quarter-end, with inflation, Core PCE and NFP on tap as AUD/USD closes in on a pivotal technical threshold.

This report is intended for general circulation only. It should not be construed as a recommendation, or an offer (or solicitation of an offer) to buy or sell any financial products. The information provided does not take into account your specific investment objectives, financial situation or particular needs. Before you act on any recommendation that may be contained in this report, independent advice ought to be sought from a financial adviser regarding the suitability of the investment product, taking into account your specific investment objectives, financial situation or particular needs.
StoneX Financial Pte. Ltd., may distribute reports produced by its respective foreign entities or affiliates within the StoneX group of companies or third parties pursuant to an arrangement under Regulation 32C of the Financial Advisers Regulations. Where the report is distributed to a person in Singapore who is not an accredited investor, expert investor or an institutional investor (as defined in the Securities Futures Act), StoneX Financial Pte. Ltd. accepts legal responsibility to such persons for the contents of the report only to the extent required by law. Singapore recipients should contact StoneX Financial Pte. Ltd. at 6826 9988 for matters arising from, or in connection with the report.
In the case of all other recipients of this report, to the extent permitted by applicable laws and regulations neither StoneX Financial Pte. Ltd. nor its associated companies will be responsible or liable for any loss or damage incurred arising out of, or in connection with, any use of the information contained in this report and all such liability is hereby expressly disclaimed. No representation or warranty is made, express or implied, that the content of this report is complete or accurate.
StoneX Financial Pte. Ltd. is not under any obligation to update this report.
Trading CFDs carries a high level of risk that may not be suitable for some investors. Consider your investment objectives, level of experience, financial resources, risk appetite and other relevant circumstances carefully. The possibility exists that you could lose some or all of your investments, including your initial deposits. If in doubt, please seek independent expert advice. Visit www.forex.com/en-sg/terms-and-policies for the complete Risk Disclosure Statement.