






USD/JPY: Bearish break signals deeper slide as US yields retreat
USD/JPY bulls are on the back foot as US bond yields retreat, triggering a key technical break. With Scott Bessent’s bold fiscal plan easing fears and Fed rate cut bets fading, the pair now skews firmly to the downside.
Share this:

- US bonds rally sending yields lower, pressuring USD/JPY
- Bessent's fiscal plan calms markets
- Shallow Fed rate cut cycle caps growth and inflation expectations
- Technical, fundamental picture favours selling USD/JPY rallies
Overview
The bullish breakout in US 10-year note futures we were anticipating has played out , with the move solidify the view that we may have seen the near-term highs for long bond yields. With a shallower Fed rate cutting now expected and Scott Bessent’s nomination as treasury secretary helping reduce perceived left-tail risks regarding the US fiscal outlook, we have the ingredients in place to cap bond yields temporarily. For yield sensitive markets such as USD/JPY, this skews directional risks to the downside.
US bond yields may have topped
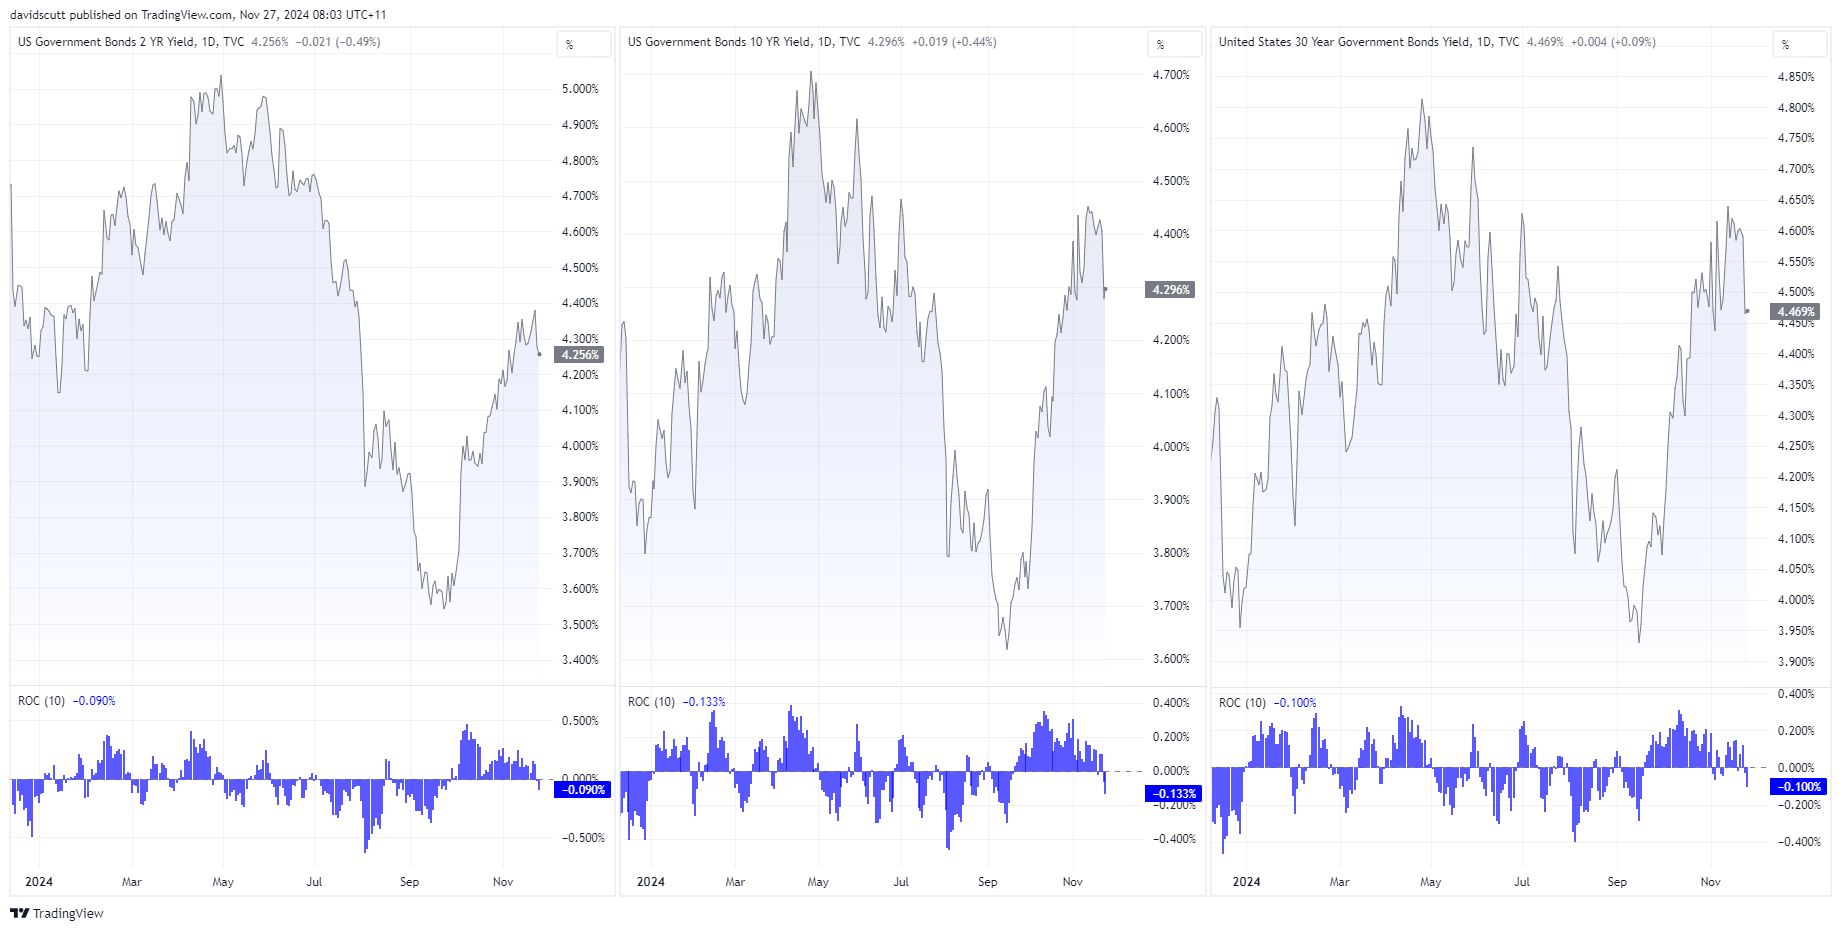
Whether you’re talking about the front, belly or back-end of the US Treasury curve, yields have fallen noticeably over the past fortnight. For two years, they’re down nine basis points with an even larger 13.3bps drop for benchmark 10-year yields, shown in the middle pane below.
Source: TradingView
Part of the decline reflects far less Fed interest rate cuts than what were anticipated months ago. Using funds rate futures as a guide, just three 25 basis point rate cuts are now priced by the end of next year, curbing speculation that US growth and inflation could accelerate meaningfully in the future.
Source: TradingView
While that explains some of the unwind in benchmark yields, don’t discount Scott Bessent’s ‘3x3’ policy platform – targeting 3% US GDP, a US budget deficit of 3% and an additional 3 million barrels per day US oil production – as another factor, with markets giving him the benefit of the doubt on whether he’ll be able to deliver.
That’s removed some of the term premium that had been added to yields to compensate for increased uncertainty towards the fiscal trajectory, placing additional downward pressure on long bond yields.
Bond breakout assists USD/JPY downside break
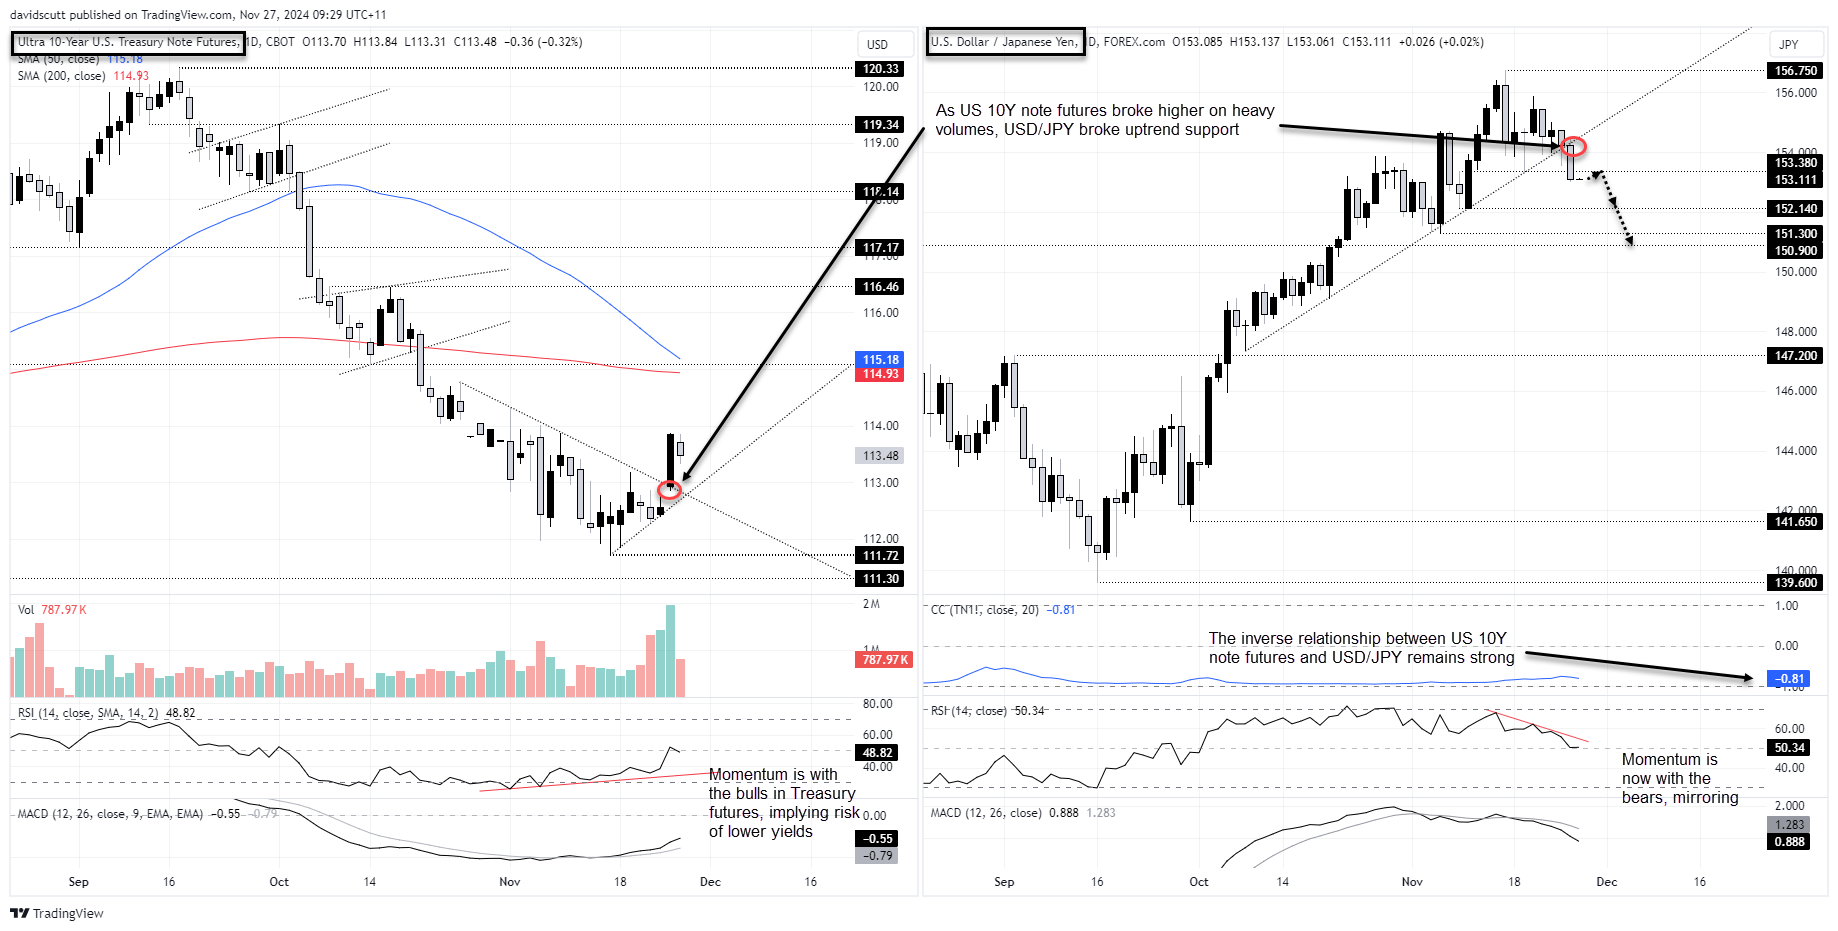
To test the theory that we've seen the near-term high for yields, the technical picture for US 10-year Treasury futures is useful, with a big bullish breakout taking place earlier this week on the back of record volumes. You can see that in the right-hand pane below.
While the surge in trading activity was associated with the contract roll, price has now joined with momentum indicators such as RSI (14) and MACD to generate a uniformly bullish signal. If it proves to be reliable, it bolsters the case for downside for benchmark yields near-term.
Source: TradingView
As flagged in our weekly forecast note, the bullish breakout in Treasury note futures has assisted a bearish break for USD/JPY, seeing the pair do away with uptrend support before going on with the move on Tuesday. It’s already taken out minor support at 153.38, leaving only 152.14 and 151.30 standing in the way of a retest of major horizontal support at 150.90.
With MACD and RSI (14) generating bearish signals, and with the inverse correlation with US 10-year Treasury note futures strong at -0.81 over the past month, USD/JPY now comes across as a sell-on-rallies play, rather than a buy-on-dips.
Those considering short setups could use 153.38 for protection, allowing for stops to be set above targeting a deeper downside flush. The preference would be to see a retest of 153.38 first, with a failure to break through solidifying the merits of the short setup. 150.90 looms as an appropriate target from a risk-reward perspective.
As communicated previously, significant volatility from upcoming US and Japanese data is not anticipated, but be mindful of potential skittish price action with liquidity likely to be poor around US Thanksgiving.
-- Written by David Scutt
Follow David on Twitter @scutty
How to trade with City Index
You can trade with City Index by following these four easy steps:
- Open an account, or log in if you’re already a customer
• Open an account in the UK
• Open an account in Australia
• Open an account in Singapore
- Search for the market you want to trade in our award-winning platform
- Choose your position and size, and your stop and limit levels
- Place the trade
Related tags:
Latest market news




Open an account in minutes
Experience award-winning platforms with fast and secure execution, and enjoy tight spreads from 0.5 pts on FX and 0.3 pts on indices.
Economic calendar
Web Trader platform
Our sophisticated web-based platform is packed with features.
Related articles
Japanese Yen Technical Analysis: USD/JPY Support Test into Core PCE
USD/JPY has been a battlefield for the past two months as the force of intervention and the threat of more have given sellers an advantage, even as buyers have continued to bid support on pullbacks. This sets the stage for a massive finish to the week with Core PCE and Non-farm Payrolls.
Gold Forecast: Are Bears Regaining Control of XAU/USD?
The start of the trading week has not been particularly favorable for gold. This can be seen in recent XAU/USD price action, with the metal falling nearly 4.00% over the last two trading sessions and bringing renewed attention to a bearish bias within the market.

Australian Dollar Forecast: AUD/USD Four-Week Slide Nears Critical Uptrend Support 9 29 2026
Aussie momentum has deteriorated sharply into quarter-end, with inflation, Core PCE and NFP on tap as AUD/USD closes in on a pivotal technical threshold.

This report is intended for general circulation only. It should not be construed as a recommendation, or an offer (or solicitation of an offer) to buy or sell any financial products. The information provided does not take into account your specific investment objectives, financial situation or particular needs. Before you act on any recommendation that may be contained in this report, independent advice ought to be sought from a financial adviser regarding the suitability of the investment product, taking into account your specific investment objectives, financial situation or particular needs.
StoneX Financial Pte. Ltd., may distribute reports produced by its respective foreign entities or affiliates within the StoneX group of companies or third parties pursuant to an arrangement under Regulation 32C of the Financial Advisers Regulations. Where the report is distributed to a person in Singapore who is not an accredited investor, expert investor or an institutional investor (as defined in the Securities Futures Act), StoneX Financial Pte. Ltd. accepts legal responsibility to such persons for the contents of the report only to the extent required by law. Singapore recipients should contact StoneX Financial Pte. Ltd. at 6826 9988 for matters arising from, or in connection with the report.
In the case of all other recipients of this report, to the extent permitted by applicable laws and regulations neither StoneX Financial Pte. Ltd. nor its associated companies will be responsible or liable for any loss or damage incurred arising out of, or in connection with, any use of the information contained in this report and all such liability is hereby expressly disclaimed. No representation or warranty is made, express or implied, that the content of this report is complete or accurate.
StoneX Financial Pte. Ltd. is not under any obligation to update this report.
Trading CFDs carries a high level of risk that may not be suitable for some investors. Consider your investment objectives, level of experience, financial resources, risk appetite and other relevant circumstances carefully. The possibility exists that you could lose some or all of your investments, including your initial deposits. If in doubt, please seek independent expert advice. Visit www.forex.com/en-sg/terms-and-policies for the complete Risk Disclosure Statement.