



USD/JPY, Nasdaq Forecast: Focus Shifts from Fed to BOJ
USD/JPY, Nasdaq Forecast: Markets shift their focus from the Fed to the Bank of Japan as carry trade risks return. Key USD/JPY and Nasdaq levels to watch ahead of the BOJ decision.
Share this:

The Federal Reserve delivered exactly what markets expected, leaving interest rates unchanged at 3.75% while maintaining a policy stance consistent with another rate hike later this year should inflation and geopolitical risks remain persistent.
With the July FOMC meeting now in the past, markets are turning their focus to tomorrow's Bank of Japan (BOJ) policy decision, which may be the next major catalyst for global markets, among many other this week.
Renewed carry trade unwind risks have already sparked a sharp reversal in USD/JPY, with the pair retreating more than 100 pips today. At the same time, elevated US Treasury yields, persistent Middle East tensions, and rising September Fed rate hike expectations continue to keep financial conditions tight.
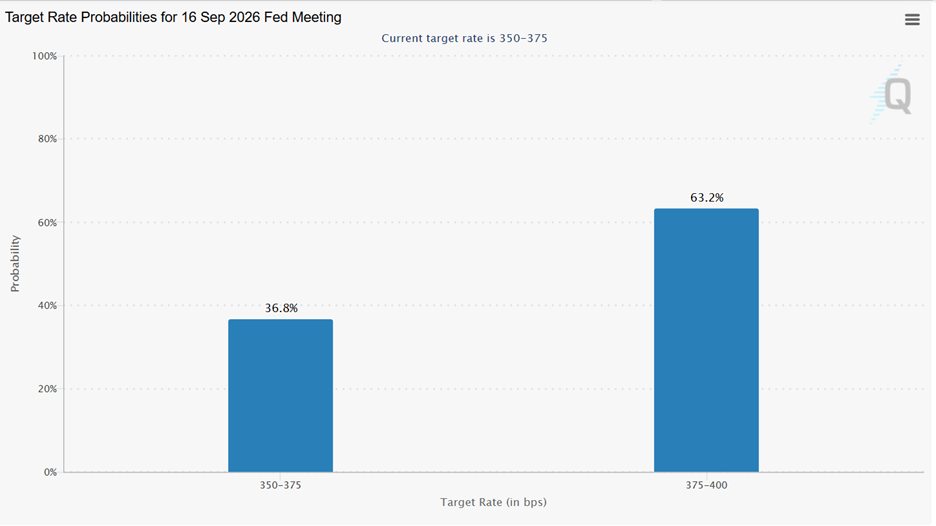
Expectations for a September Rate Hike Persist
Source: CME Fed Watch Tool
According to the CME FedWatch Tool, markets continue to price more than a 60% probability of a 25-basis-point rate hike in September, supporting the US dollar while limiting broader risk appetite.
Tomorrow's BOJ meeting now becomes critical. Any indication of stronger inflation concerns or steep intervention could accelerate carry trade unwind risks, increasing volatility across currencies, Treasury yields, and equity markets.
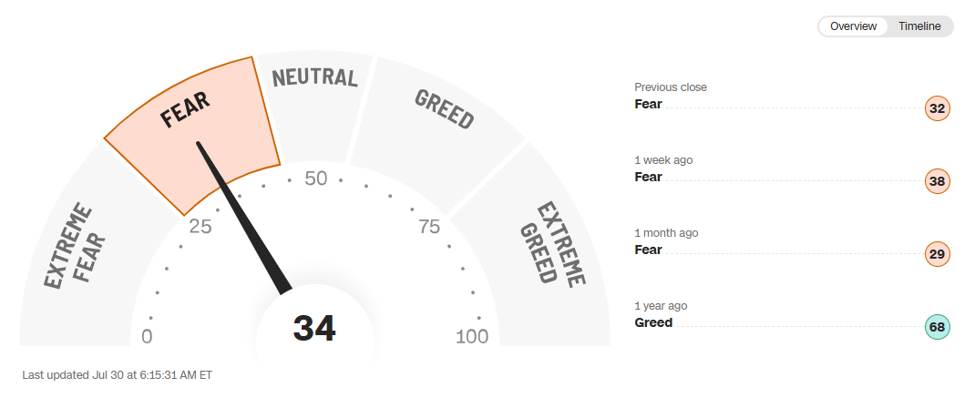
CNN Fear & Greed Indicator
Source: CNN
Investor sentiment remains cautious.
Although Microsoft's earnings exceeded expectations, Meta's weaker guidance reinforced concerns surrounding AI spending, limiting the positive impact on technology shares.
At the same time:
- Middle East tensions remain elevated.
- US Treasury yields continue trading near multi-year highs.
- Carry trade risks have returned ahead of the BOJ meeting.
Taken together, these factors suggest volatility is likely to remain elevated into the end of the week. To Quantify the risks, the following technical scenarios are outlined

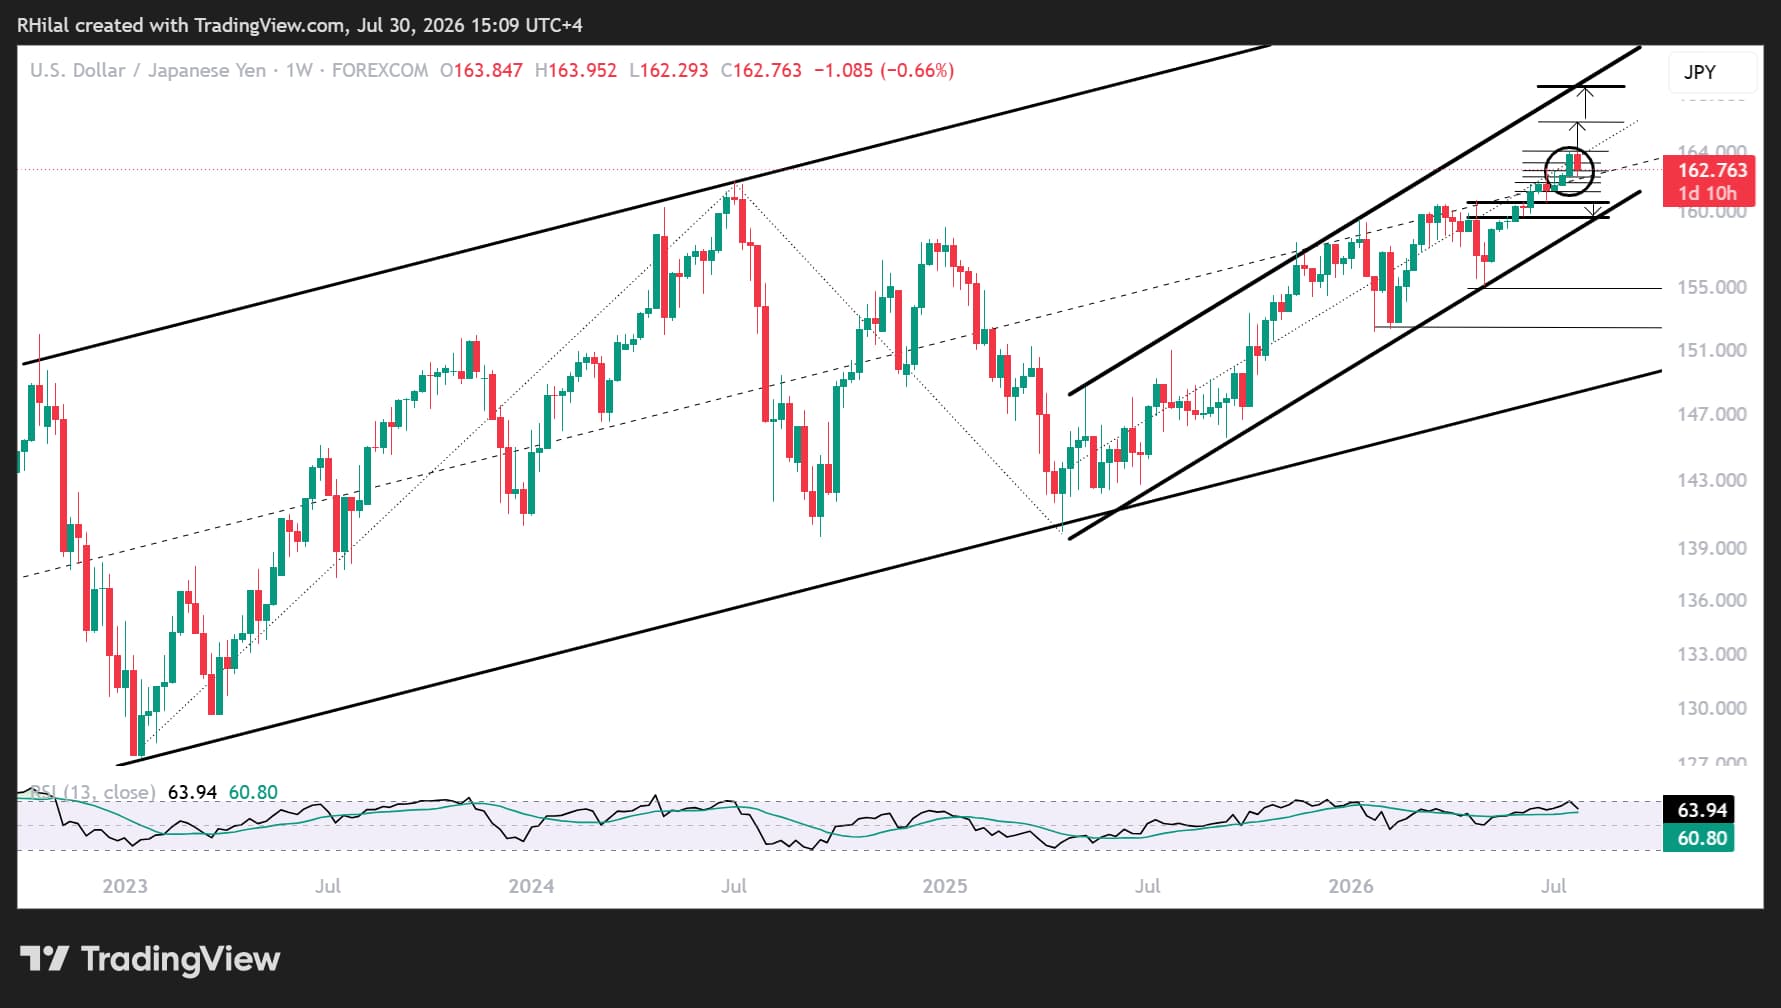
USDJPY Price Outlook: Weekly Time Frame – Log Scale
Source: Trading view
USDJPY is starting to show signs of pullback risks below the 164 resistance, in line with overbought momentum conditions on the weekly time frame and speculation of meaningful intervention risks by the BOJ. To quantify the scenarios: The weekly USD/JPY chart reflects two well-respected ascending channels.
The first has guided price action between April 2025 and April 2026, while the second represents the broader bullish structure that has been in place since 2022.
Price is now attempting to break above the midpoints of both channels. This creates a critical confluence zone that could open the way toward the Fibonacci extensions of the February-April-May 2026 cycle.
The 164 level is positioned near the 100% Fibonacci extension, followed by:
- 165: 127.2% Fibonacci extension
- 168: 161.8% Fibonacci extension
- 170: Upper boundary of the shorter-term channel, where pullback risk may increase
- 180: The next major upside zone if the 170 resistance fails to contain the advance, aligning with the broader 2022-2026 channel
The steep upside scenario remains valid as long as the DXY stays firm above the 100.30 zone.
The bullish structure also depends on whether intervention in Japanese markets remains less influential than the impact of yield differentials and geopolitical risk, as the US30Y aligns with decade highs above 5.2%.
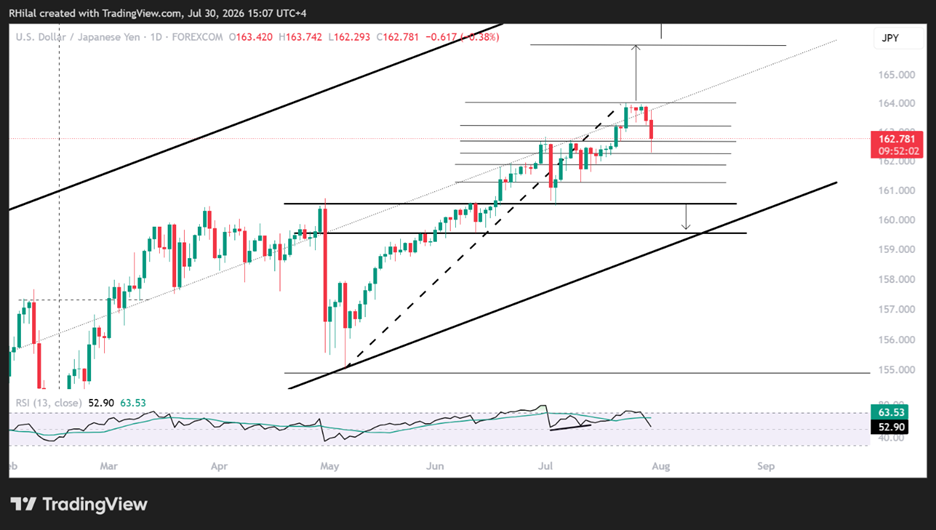
USDJPY Price Outlook: Daily Time Frame – Log Scale
Source: Trading view
On the downside, a break below 162.20, 161.20, and 160.50 would place several previous resistance levels—now acting as potential support—under pressure.
A sustained decline through these levels would expose the lower boundary of the ascending channel near 159.
That area could generate another rebound within the broader bullish trend that has been in place since April 2025. However, a confirmed break below the channel would weaken the bullish bias, particularly if accompanied by a broader decline in the US dollar below 100.30-99.30.
Nasdaq Price Outlook: Daily Time Frame – Log Scale
Source: Trading view
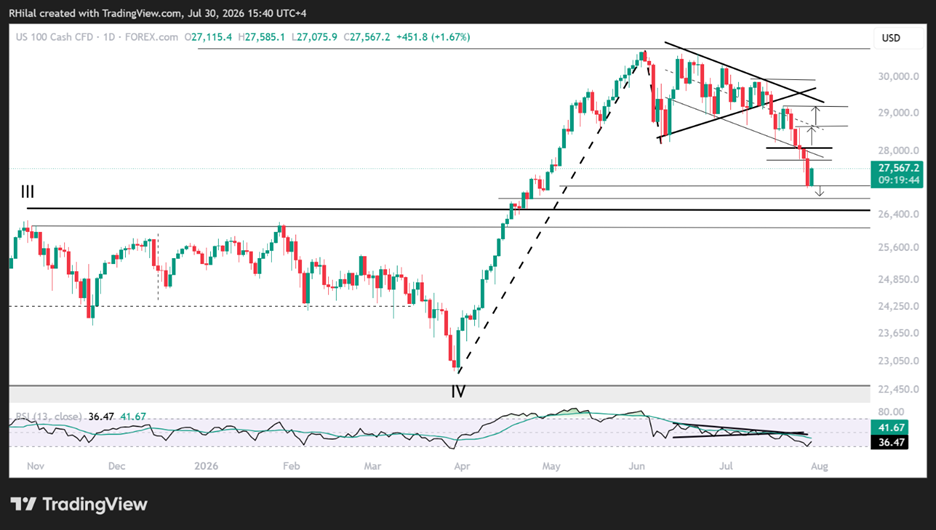
Nasdaq's daily time frame outlook remains cautiously bearish, as price action continues to trade below both the June-July consolidation range and the upper boundary of a descending channel extending from this year's highs. However, daily momentum has reached its triangle breakout target and oversold conditions last seen in March 2026. Momentum also remains subdued, suggesting buyers have yet to regain control.
Bullish Scenario
To restore upside momentum, Nasdaq must first reclaim 27,700 and 28,000 (the lower boundary of the descending channel), followed by 28,600 and 29,000 (the midpoint and upper boundary of the channel).
These levels remain critical resistance zones where renewed selling pressure could emerge as Nasdaq attempts to rebound.
A breakout above 29,400, representing the upper boundary of both the descending channel and the June-July consolidation, would strengthen bullish confidence for a return toward record highs, potentially opening the door to another 1,000-2,000-point advance toward 31,700 and 32,700. However, that scenario would likely require, at a minimum, greater geopolitical stability.
Bearish Scenario
Failure to hold 27,000, followed by a break below 26,700, would expose the next downside targets at 26,480 and 26,000, corresponding to the 1.5 and 1.618 Fibonacci extensions of the wave spanning the June highs.
These areas could present renewed buying opportunities, particularly as they coincide with oversold momentum conditions and previous highs from 2025 and 2026, especially if geopolitical tensions ease, crude oil prices stabilize, and markets shift expectations toward a less hawkish Federal Reserve.
Written by Razan Hilal, CMT
Follow on X: @Rh_waves
Latest market news




Open an account in minutes
Experience award-winning platforms with fast and secure execution, and enjoy tight spreads from 0.5 pts on FX and 0.3 pts on indices.
Economic calendar
Web Trader platform
Our sophisticated web-based platform is packed with features.
Related articles
US Core PCE Preview: Stale or Significant for the Fed
Core PCE inflation takes center stage Wednesday, with traders watching for signs of renewed price pressure and clues on whether the Fed could hike again in October.
Japanese Yen Technical Analysis: USD/JPY Support Test into Core PCE
USD/JPY has been a battlefield for the past two months as the force of intervention and the threat of more have given sellers an advantage, even as buyers have continued to bid support on pullbacks. This sets the stage for a massive finish to the week with Core PCE and Non-farm Payrolls.

Australian Dollar Forecast: AUD/USD Four-Week Slide Nears Critical Uptrend Support 9 29 2026
Aussie momentum has deteriorated sharply into quarter-end, with inflation, Core PCE and NFP on tap as AUD/USD closes in on a pivotal technical threshold.

This report is intended for general circulation only. It should not be construed as a recommendation, or an offer (or solicitation of an offer) to buy or sell any financial products. The information provided does not take into account your specific investment objectives, financial situation or particular needs. Before you act on any recommendation that may be contained in this report, independent advice ought to be sought from a financial adviser regarding the suitability of the investment product, taking into account your specific investment objectives, financial situation or particular needs.
StoneX Financial Pte. Ltd., may distribute reports produced by its respective foreign entities or affiliates within the StoneX group of companies or third parties pursuant to an arrangement under Regulation 32C of the Financial Advisers Regulations. Where the report is distributed to a person in Singapore who is not an accredited investor, expert investor or an institutional investor (as defined in the Securities Futures Act), StoneX Financial Pte. Ltd. accepts legal responsibility to such persons for the contents of the report only to the extent required by law. Singapore recipients should contact StoneX Financial Pte. Ltd. at 6826 9988 for matters arising from, or in connection with the report.
In the case of all other recipients of this report, to the extent permitted by applicable laws and regulations neither StoneX Financial Pte. Ltd. nor its associated companies will be responsible or liable for any loss or damage incurred arising out of, or in connection with, any use of the information contained in this report and all such liability is hereby expressly disclaimed. No representation or warranty is made, express or implied, that the content of this report is complete or accurate.
StoneX Financial Pte. Ltd. is not under any obligation to update this report.
Trading CFDs carries a high level of risk that may not be suitable for some investors. Consider your investment objectives, level of experience, financial resources, risk appetite and other relevant circumstances carefully. The possibility exists that you could lose some or all of your investments, including your initial deposits. If in doubt, please seek independent expert advice. Visit www.forex.com/en-sg/terms-and-policies for the complete Risk Disclosure Statement.