



USD Pulls Back on Ceasefire Hopes: USD/JPY, EUR/USD, GBP/USD
USD/JPY has pulled back quickly from yesterday’s test of 160.00 and that’s driven a wave of selling in the USD, driven by hopes that the ceasefire around Iran will mark an eventual end to the conflict. It’s still early, though.
Share this:

The US Dollar has put in a fast pullback on the back of ceasefire hopes in Iran. It’s still early though, and there’s already reports that the ceasefire may not hold as highlighted by a couple of items early in the above video.
From a markets perspective the ceasefire announcement led to a scaling-back in some of the tension that’s shown and in FX markets, that’s the 160.00 level in USD/JPY. That price was tested around yesterday’s webinar but hopes then showed up that President Trump’s deadline may get pushed back. On the actual announcement later that night, several risk-on moves showed with gold breaking out, stocks continuing their rally and USD/JPY pulling back from the 160.00 handle.
The EUR/USD and GBP/USD setups looked at in yesterday’s webinar stretched with strong rallies.
In the DXY basket, we now have a test of a lower-low and there’s a big spot of support a little lower, around the 97.94 Fibonacci level that was ascending triangle resistance in February, ahead of the March breakout fueled by the conflict in Iran.
US Dollar Daily Price Chart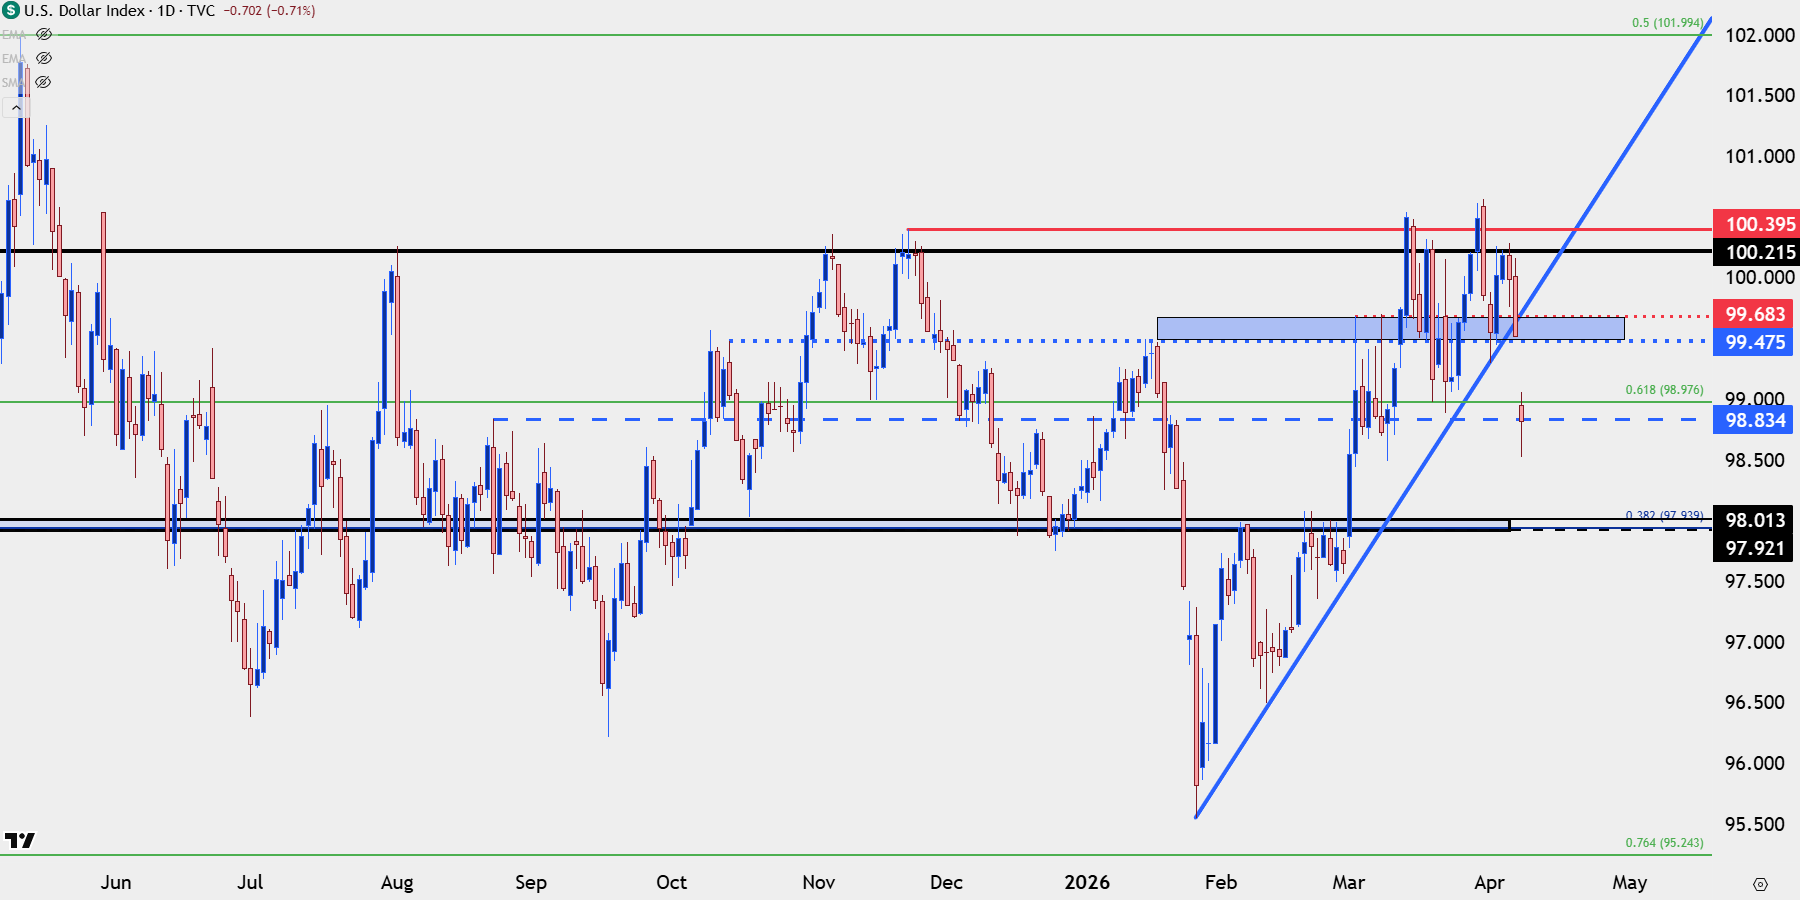
Chart prepared by James Stanley; data derived from Tradingview
USD/JPY
I remain of the mind that USD/JPY is the big push point for USD trends across the FX market, and the longer-term move in the pair illustrates why. The trade is still crowded and the rate divergence between the two economies still provides bullish motive.
Notably, it’s US CPI prints that drove reversals/pullbacks in 2022 and 2023, along with the bullish breakout in April of 2024, and we’re getting a very important US CPI print on Friday of this week.
If we do see continued tension in the Middle East, that’s a push on the long side of oil prices, which also pushes on higher inflation. This gives USD/JPY bulls a reason to push breakouts and the Bank of Japan is in the difficult spot of defending a line-in-the-sand that’s already started to give way.
With tensions easing on the back of ceasefire hopes we’ve seen the pair pullback, but there’s still bullish structure here as we have a test of support at prior resistance, taken from around 157.66-157.90.
USD/JPY Daily Price Chart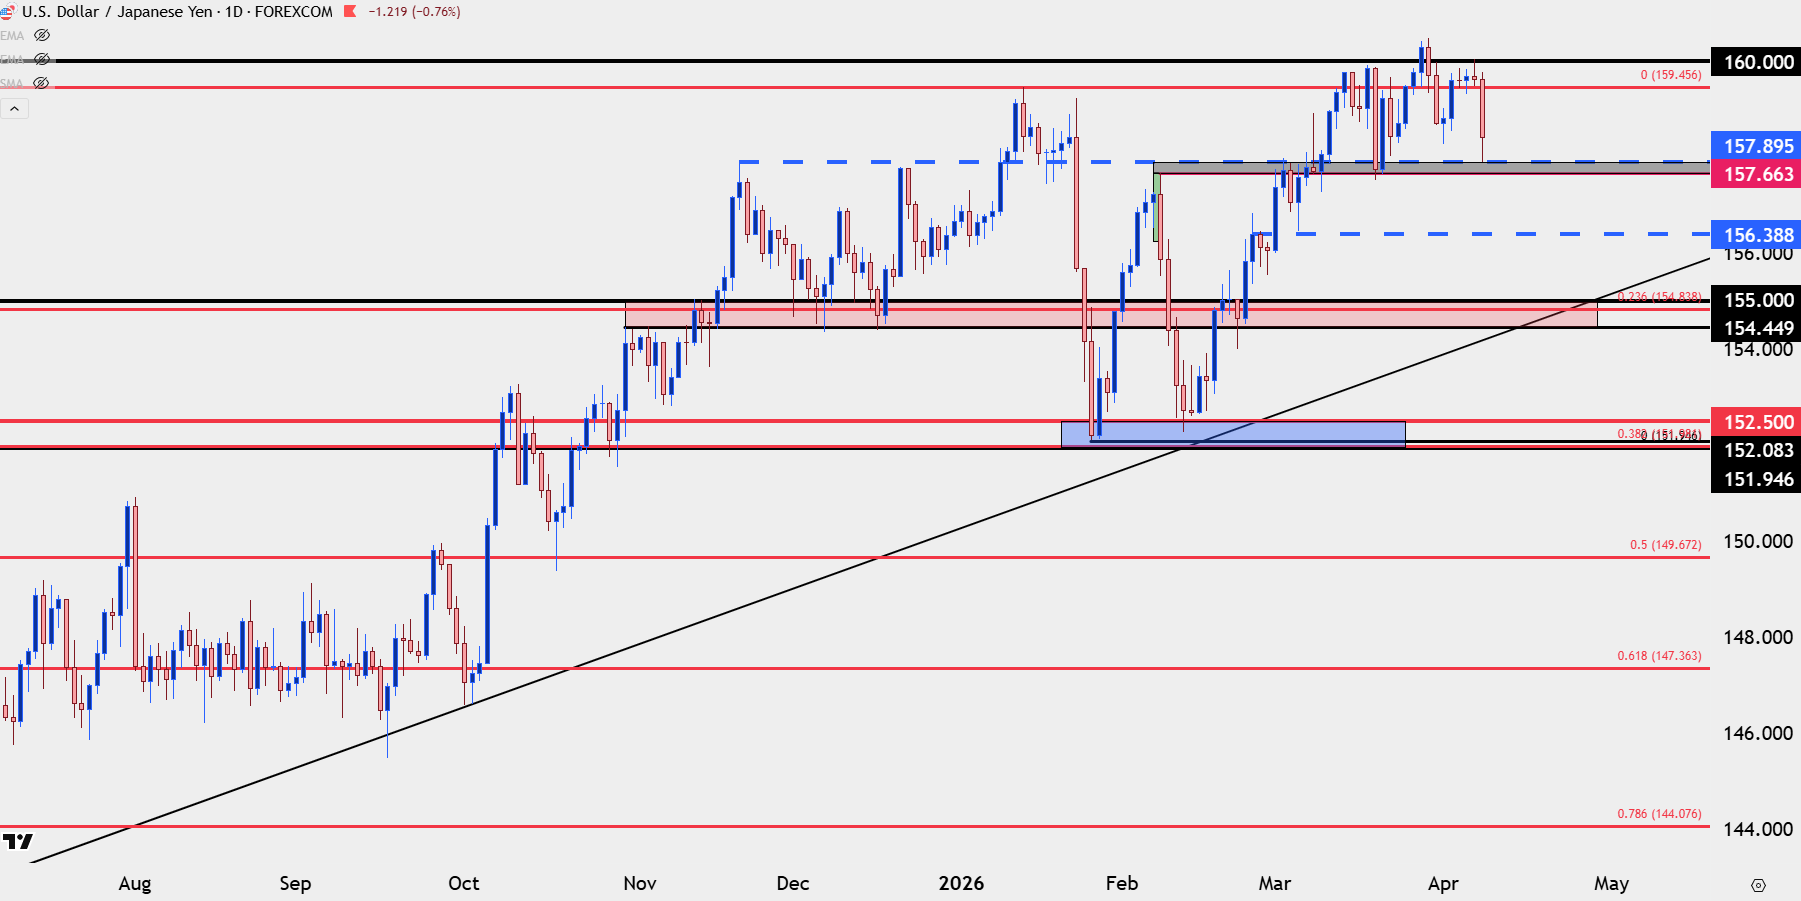
Chart prepared by James Stanley; data derived from Tradingview
EUR/USD Breakout
It’s the build of higher-lows over the past month that impressed in EUR/USD. The 1.1411 swing low was defended with a 1.1451 higher-low, and that spot held on a second test in late-March before a higher-low developed around the 1.1500 handle earlier this week.
That set the stage for last night’s breakout, and at this point there’s now bullish structure to work with on both the four-hour and daily charts.
Prior resistance is now support potential, spanning from 1.1628-1.1655. And next resistance is prior support from 1.1742-1.1766.
EUR/USD Four-Hour Price Chart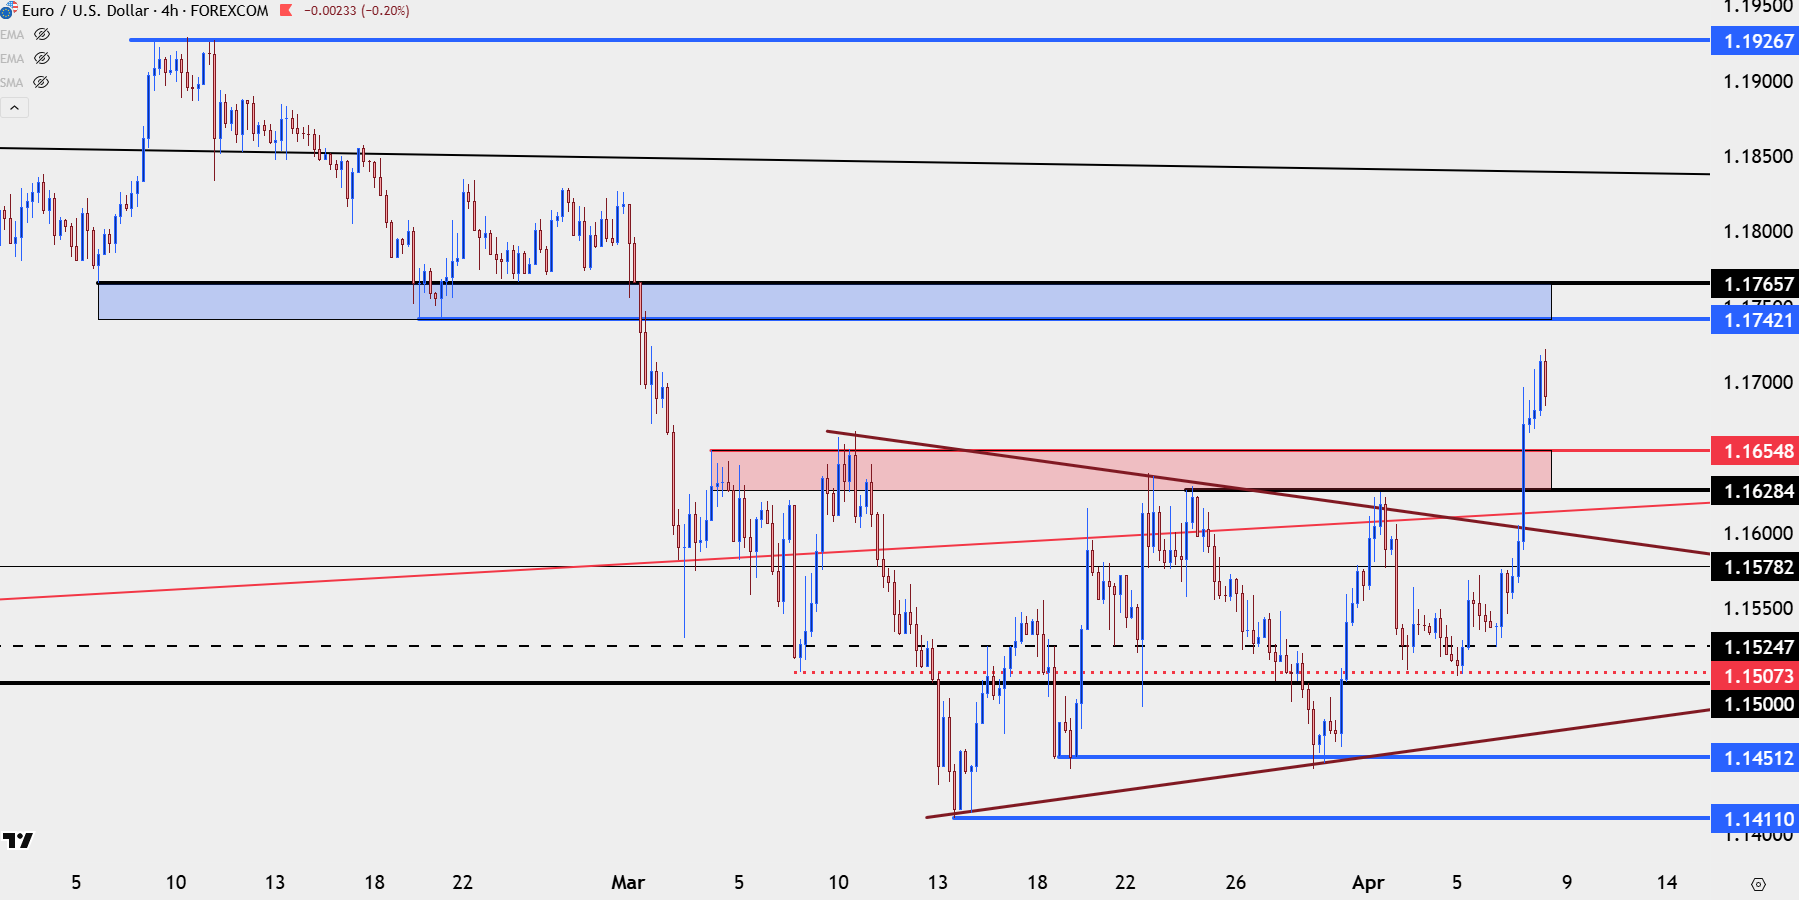
Chart prepared by James Stanley; data derived from Tradingview
EUR/GBP
While EUR/USD has shown more respectable bullish structure over the past month, EUR/GBP was indicating that change may be afoot, as the cross pair was testing a key zone of resistance at a Fibonacci level that I had looked at on Monday and Tuesday.
And with USD weakness coming in on the back of ceasefire hopes, both EUR/USD and GBP/USD have broken out, although the move in Cable has been approximately 25% larger than that in EUR/USD, as looked at in the above video.
This also shows in a resistance reaction in the cross-pair, as EUR/GBP has fallen from resistance and is now approaching a test of support at prior resistance.
EUR/GBP Daily Chart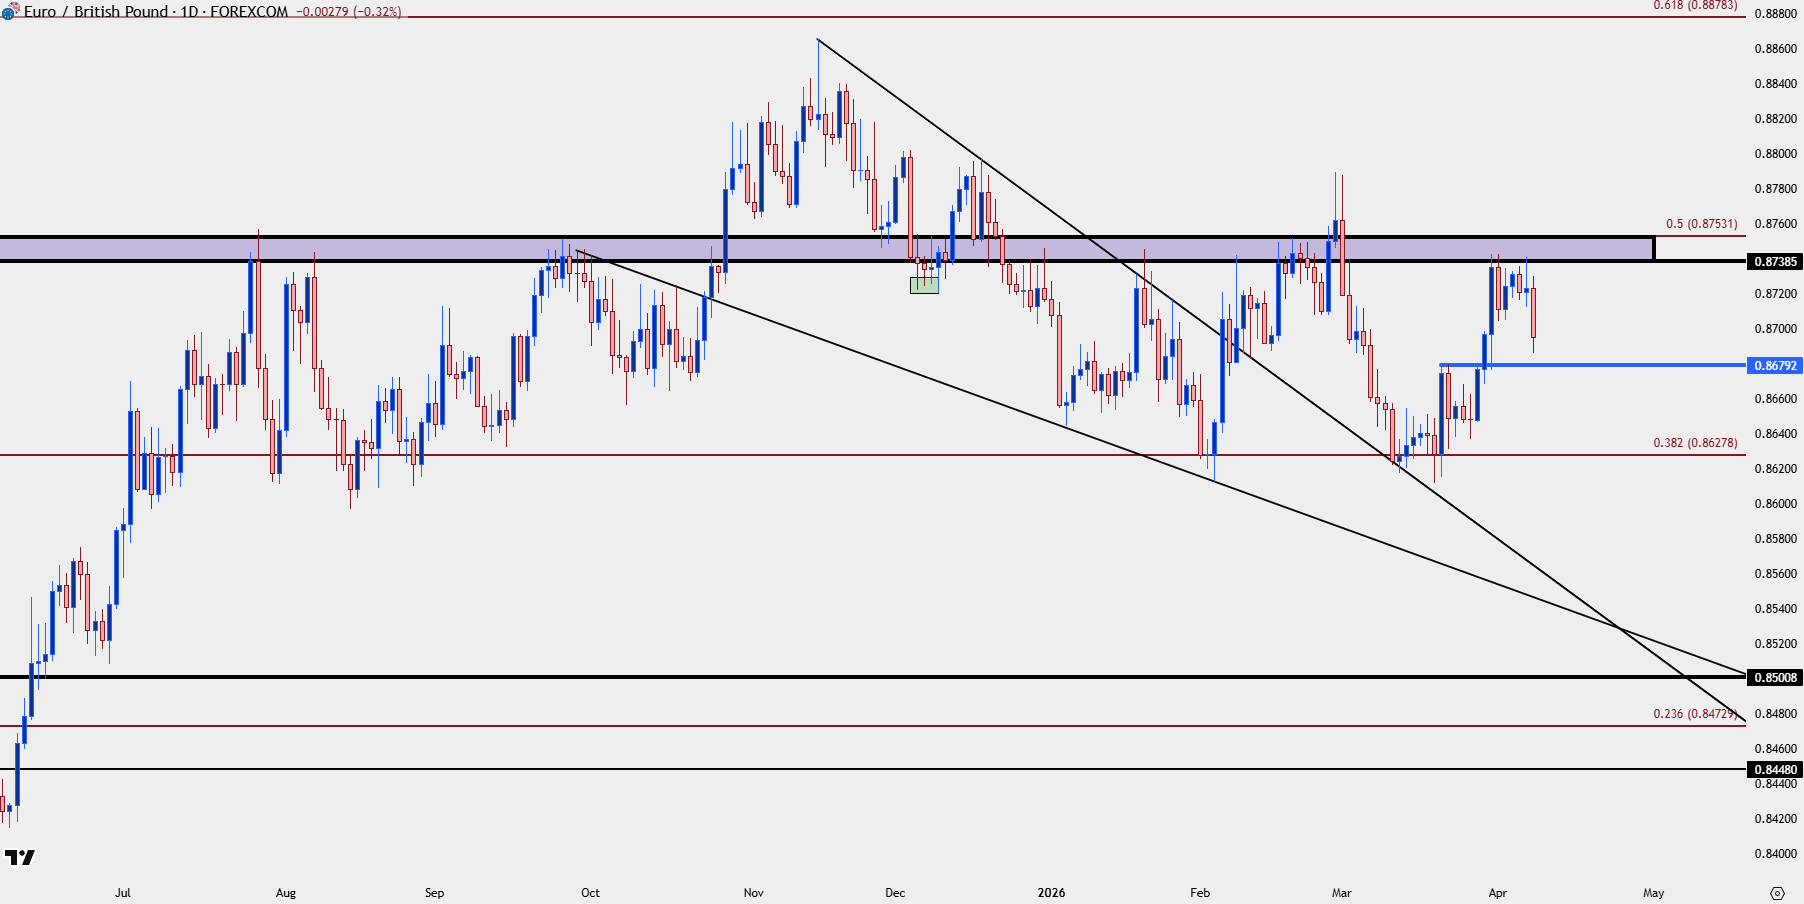
Chart prepared by James Stanley; data derived from Tradingview
GBP/USD
While EUR/USD has been working on higher lows over the past few weeks, GBP/USD has now. Even this week showed a re-test of support at the same level that was in-play previously and this was even as EUR/USD was setting up a higher-low at the 1.1500 level.
But, as USD-weakness has come on the jump in GBP/USD has been larger and from the daily chart, the falling wedge looked at in yesterday’s webinar has since led to a strong breakout in the pair, with price pushing up to prior resistance just inside of the 1.3500 handle.
At this point, there’s support potential at prior resistance, with the zone of 1.3414-1.3434 already close to coming back into play. Below that, there’s a swing level at 1.3373 and then a key zone from around 1.3250-1.3283.
GBP/USD Four-Hour Price Chart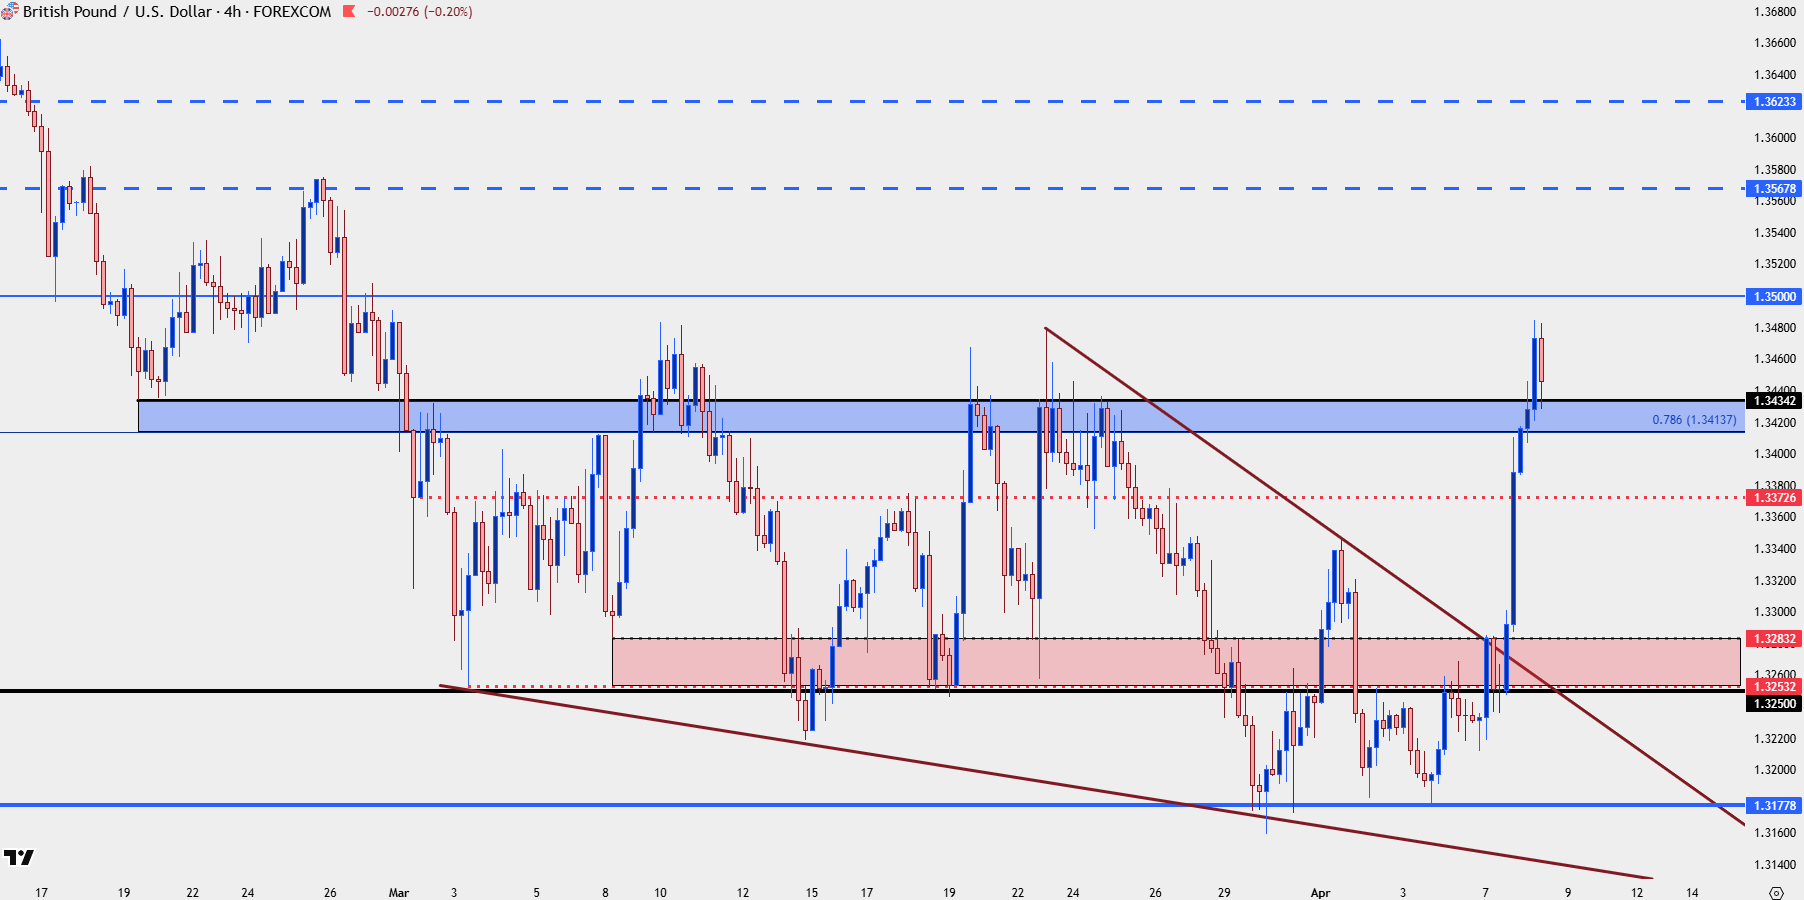
Chart prepared by James Stanley; data derived from Tradingview
--- written by James Stanley, Senior Market Analyst, Global Macro


Open an account in minutes
Experience award-winning platforms with fast and secure execution, and enjoy tight spreads from 0.5 pts on FX and 0.3 pts on indices.
Economic calendar
Web Trader platform
Our sophisticated web-based platform is packed with features.
Related articles

USD into a Massive Week as Yields Fly and Gold Breaks
It’s a huge week with PCE and NFP, but it’s what’s happening off of the calendar that demands attention with US yields flying to fresh multi-decade highs.

USDJPY Forecast Intervention Fears Clash with Dollar Strength
Recent trading sessions have produced mixed results for the Japanese yen. By the end of last week, USD/JPY had fallen by more than 1.00%, reflecting a modest recovery in the yen. However, the start of this week has seen the pair move slightly back in favor of the U.S. dollar, posting gains of around 0.04%.


US Dollar Bulls Return as Euro and Pound Shorts Build | COT Report
US dollar net-longs surged at their fastest pace in seven years as futures traders added bearish exposure to the euro and British pound.

This report is intended for general circulation only. It should not be construed as a recommendation, or an offer (or solicitation of an offer) to buy or sell any financial products. The information provided does not take into account your specific investment objectives, financial situation or particular needs. Before you act on any recommendation that may be contained in this report, independent advice ought to be sought from a financial adviser regarding the suitability of the investment product, taking into account your specific investment objectives, financial situation or particular needs.
StoneX Financial Pte. Ltd., may distribute reports produced by its respective foreign entities or affiliates within the StoneX group of companies or third parties pursuant to an arrangement under Regulation 32C of the Financial Advisers Regulations. Where the report is distributed to a person in Singapore who is not an accredited investor, expert investor or an institutional investor (as defined in the Securities Futures Act), StoneX Financial Pte. Ltd. accepts legal responsibility to such persons for the contents of the report only to the extent required by law. Singapore recipients should contact StoneX Financial Pte. Ltd. at 6826 9988 for matters arising from, or in connection with the report.
In the case of all other recipients of this report, to the extent permitted by applicable laws and regulations neither StoneX Financial Pte. Ltd. nor its associated companies will be responsible or liable for any loss or damage incurred arising out of, or in connection with, any use of the information contained in this report and all such liability is hereby expressly disclaimed. No representation or warranty is made, express or implied, that the content of this report is complete or accurate.
StoneX Financial Pte. Ltd. is not under any obligation to update this report.
Trading CFDs carries a high level of risk that may not be suitable for some investors. Consider your investment objectives, level of experience, financial resources, risk appetite and other relevant circumstances carefully. The possibility exists that you could lose some or all of your investments, including your initial deposits. If in doubt, please seek independent expert advice. Visit www.forex.com/en-sg/terms-and-policies for the complete Risk Disclosure Statement.