


USD Rallies from Support Post-FOMC: EUR/USD, USD/JPY
US equities are at session lows and the USD to fresh highs after the FOMC presser, with more risk events on the horizon with BoJ, BoE and ECB all set for rate decision in the next 18 hours.
Share this:


Jerome Powell didn’t feed the doves at today’s presser even though the FOMC projections issued at 2PM ET didn’t seem all too hawkish. While the Fed is looking for higher levels of inflation than they were at the last quarterly rate decision in December, they also boosted forecasts for growth this year while maintaining the expectation for the unemployment rate at 4.4%.
The reaction in markets is perhaps the most important takeaway and at this point US equities are at session lows following a strong reversal in the Russell 2000 index after having visited key support at 2556 earlier this morning. I looked into those backdrops in equities over the weekend and the support zones in each all remain in-play as we push past the halfway point of the week.
In currencies, however, much remains to be seen as we have rate decisions out of Japan, the UK and Europe through tomorrow morning; and those are the three largest components of the DXY basket in the Yen, Pound and Euro so DXY still very much remains in focus.
If you want a fundamental rundown of today’s FOMC meeting, Matt Weller just covered that in his post-Fed piece. In this article, I’ll be looking at the technical backdrop with updates from yesterday’s webinar, as structure remains in-place from that.
For DXY structure, yesterday saw a test of support and that support has since held at 99.48. The falling wedge that built into this morning has been broken and buyers are already pushing back above the 100 level, with 100.22 and 100.54 as the next waypoints overhead.
Interestingly, while expectations are still largely for the Fed to cut this year, rising expectations for as many as two rate hikes out of the ECB hasn’t been able to reverse the sell-off that’s remained in place in the Euro and I’ll look at that chart in just a moment.
US Dollar Hourly Price Chart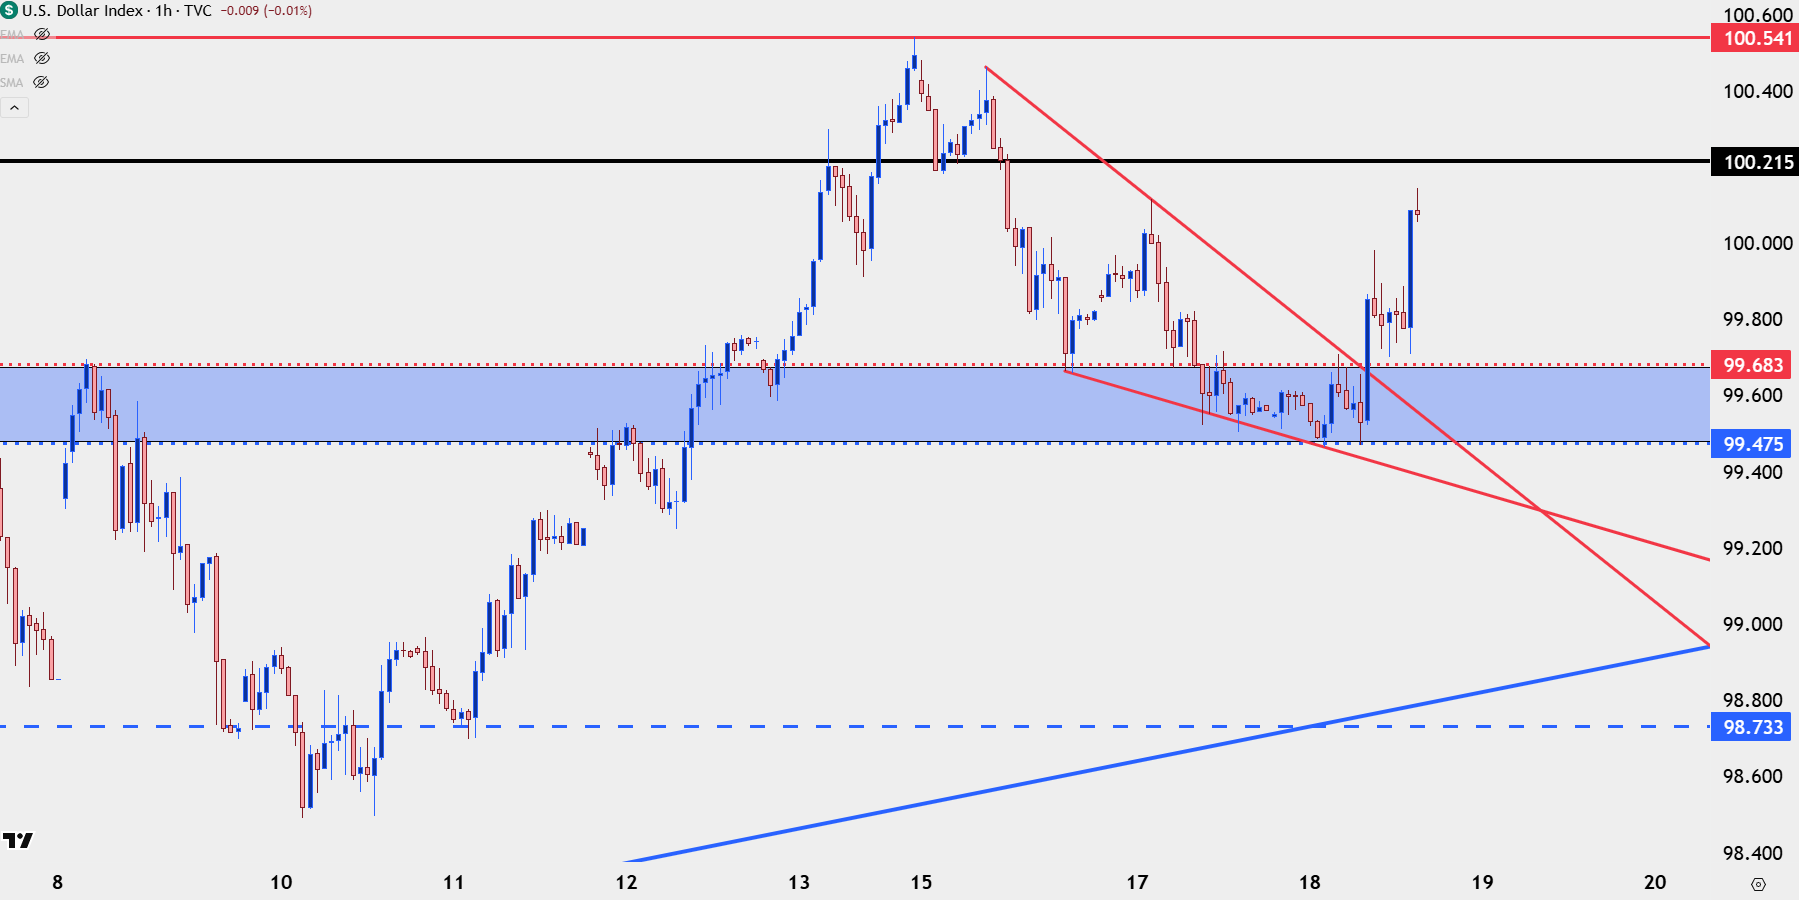
Chart prepared by James Stanley; data derived from Tradingview
USD Bigger Picture
It was an ascending triangle that had built in the USD in February that led to the March breakout. And longer-term, there’s now another ascending triangle in-play with the current resistance level after numerous inflections and reversals last year. If the USD breaks out on the back of the Central Bank meetings on the calendar we can be looking at a very different reality in the not-too-distant future, as there’s not much to stop the move until the 102.00 handle comes into play. And given that we’ve already seen equities tripping backwards today I think the ramifications of such a move in DXY could be far reaching. But, there’s a chance that doesn’t happen and I think whether or not it does will boil back to the BoJ which I’ll touch on in a moment.
USD/JPY Daily Price Chart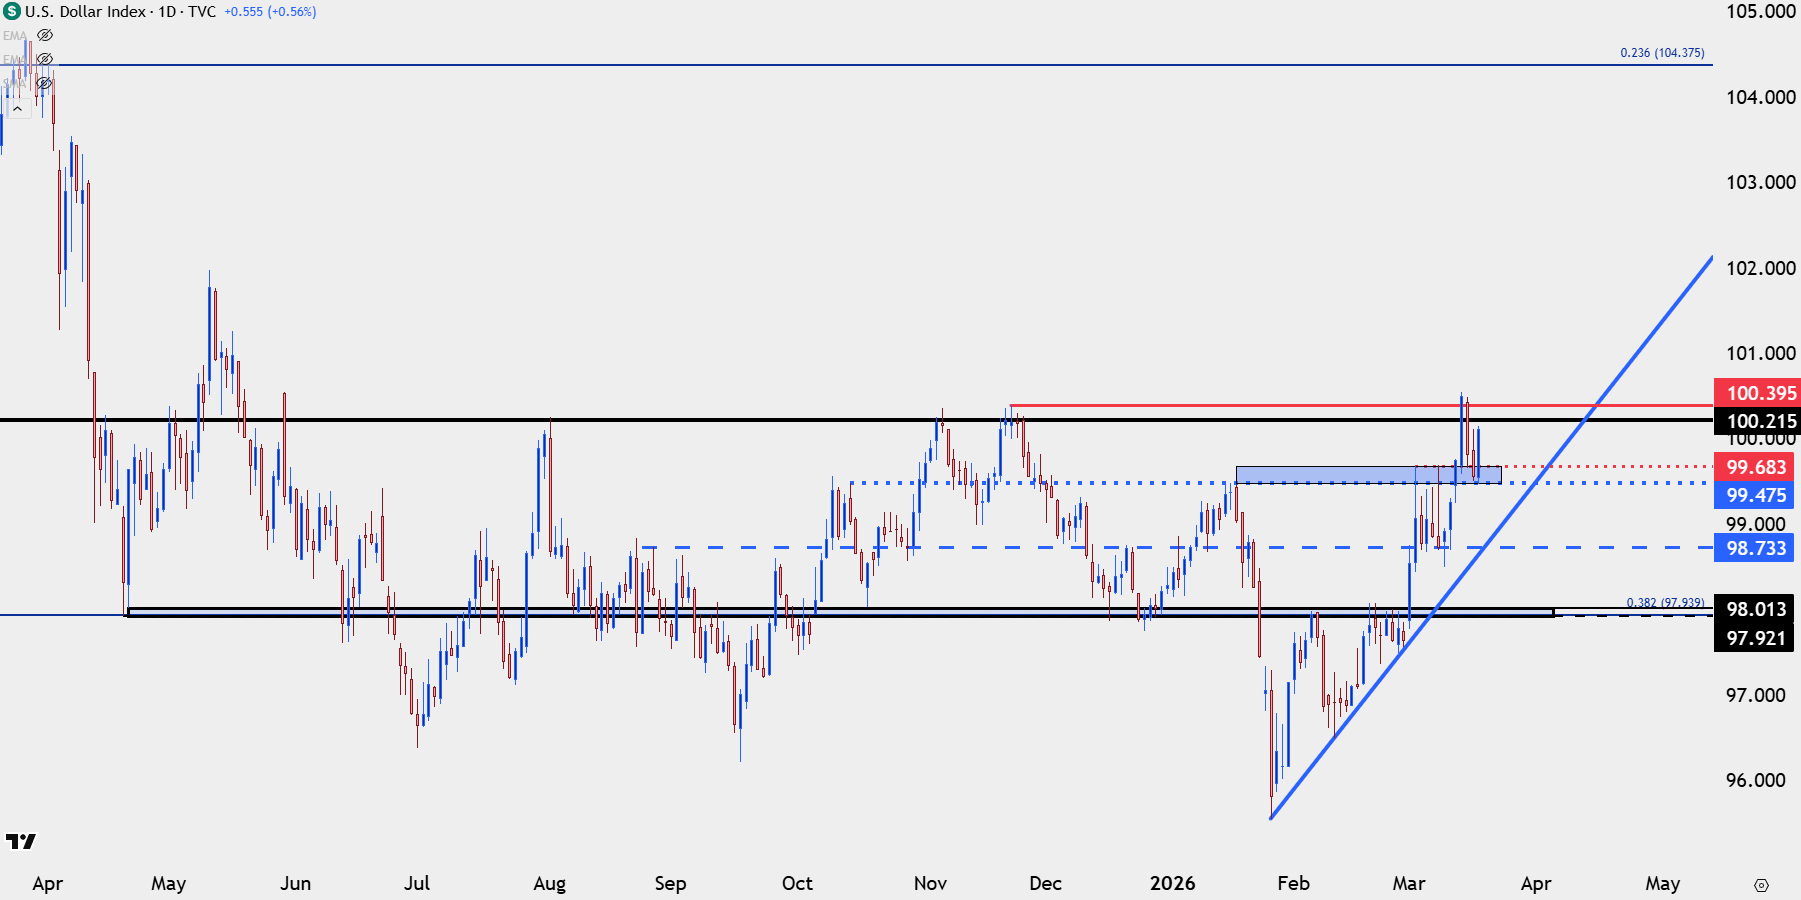
Chart prepared by James Stanley; data derived from Tradingview
EUR/USD
When the USD broke down in late-January the move seemed to be mostly fueled by USD/JPY. This might not sound sensible given that the Yen is just a 13.6% component of the DXY basket, but looking at the longer-term chart explains this better as the built-in long positioning behind the carry trade shows a crowded market position, and if it does begin to unwind the consequences can be massive – to the point where even USD/JPY selling could drive rallies in EUR/USD, much like we saw in late-January when the EUR/USD pair went into deep overbought levels while trading above the 1.2000 handle.
Interestingly the rates backdrop around Europe is now more hawkish, with markets expecting as many as two rate cuts from the ECB this year. You wouldn’t know it from looking at the EUR/USD chart, however, as the pair continues to grind on the 1.1500 level after having pushed into oversold territory on the daily chart just a little more than a month after going overbought.
EUR/USD Daily Chart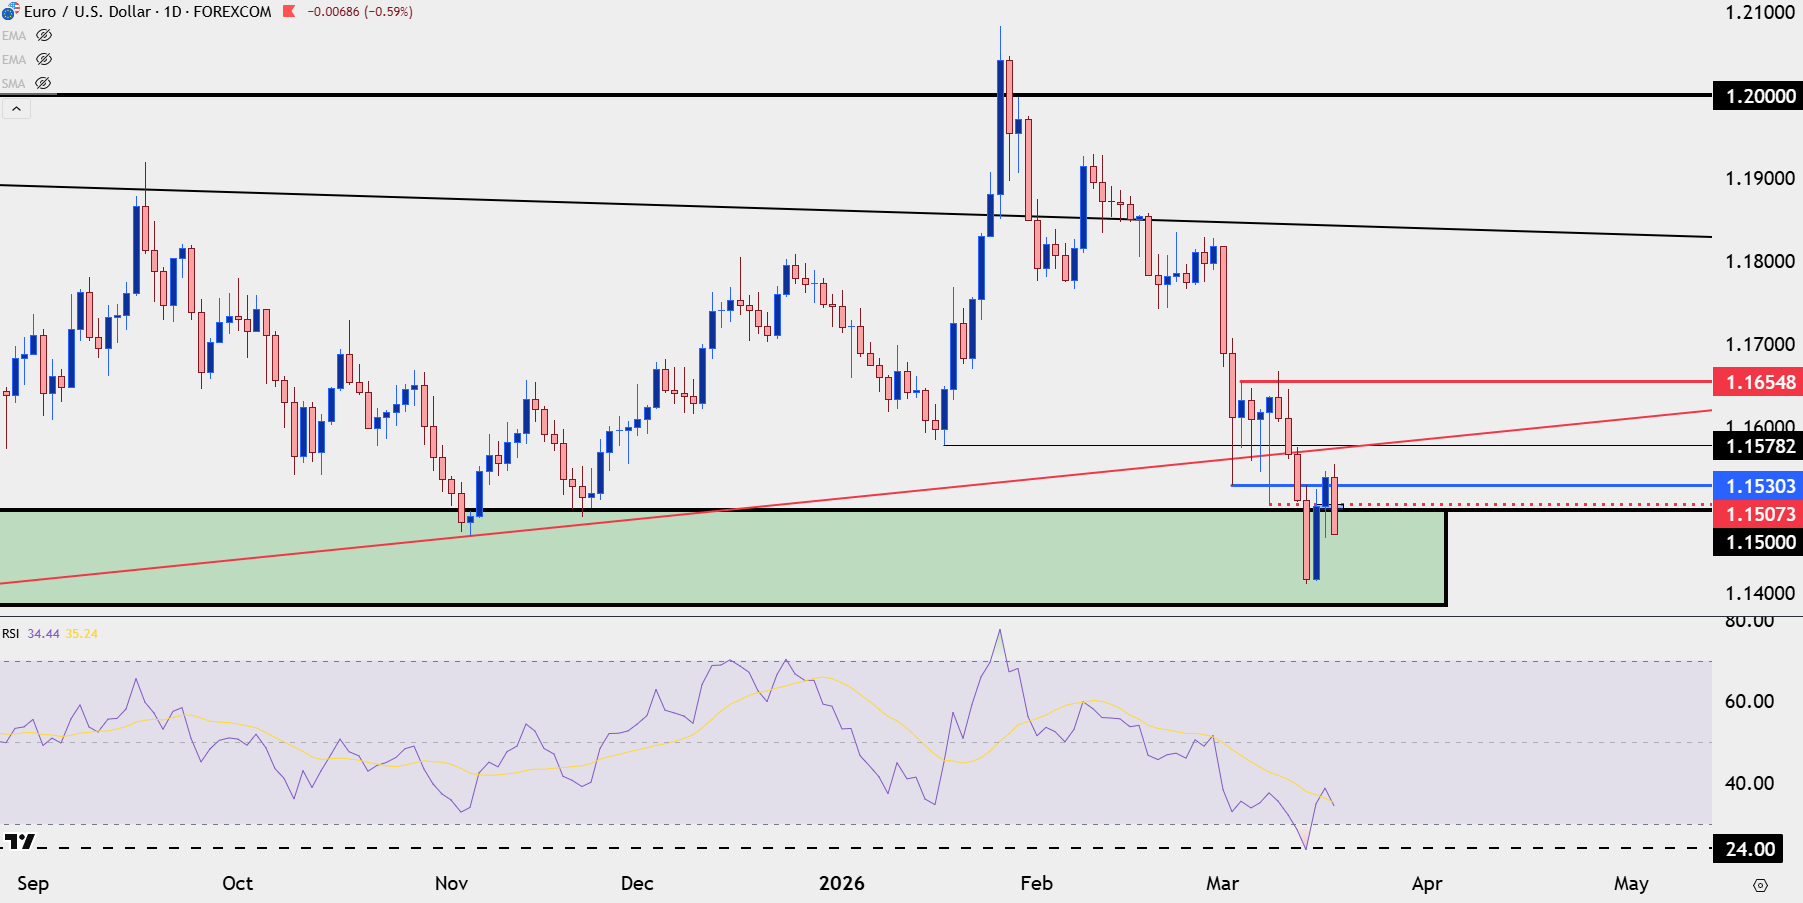
Chart prepared by James Stanley; data derived from Tradingview
EUR/USD Shorter-Term
Given the trend I think it’s probably easy to be bearish on EUR/USD at the moment. But – what we saw in both USD and EUR/USD in January and early-February can be informative.
When we get a deep oversold read like we had in EUR/USD last week, the backdrop is ill suited to chase the trend. Instead, waiting for a pullback to see how sellers respond can highlight continuation potential which, so far, has held as bears are pushing prices back below the 1.1500 level.
That mirrors the USD backdrop from a couple months ago quite well, when DXY went deep into oversold territory which was followed by a pullback to 97.94. But – it was the reaction to that resistance – which set a higher-low that built the ascending triangle. And that’s the formation that led way to the March breakout in the pair.
In EUR/USD terms, we’ve seen the pullback, and we’ve seen the response from sellers. The question now is whether they can stretch it down to a fresh low or whether buyers step in to hold a higher-low that can lead into bullish counter-trend themes.
With ECB on the cards for tomorrow this would probably need to be pushed by a hawkish outlay from Christine Lagarde at the press conference, designed to strengthen the single currency in order to buffer inflationary pressure, even if just a little bit.
EUR/USD Four-Hour Chart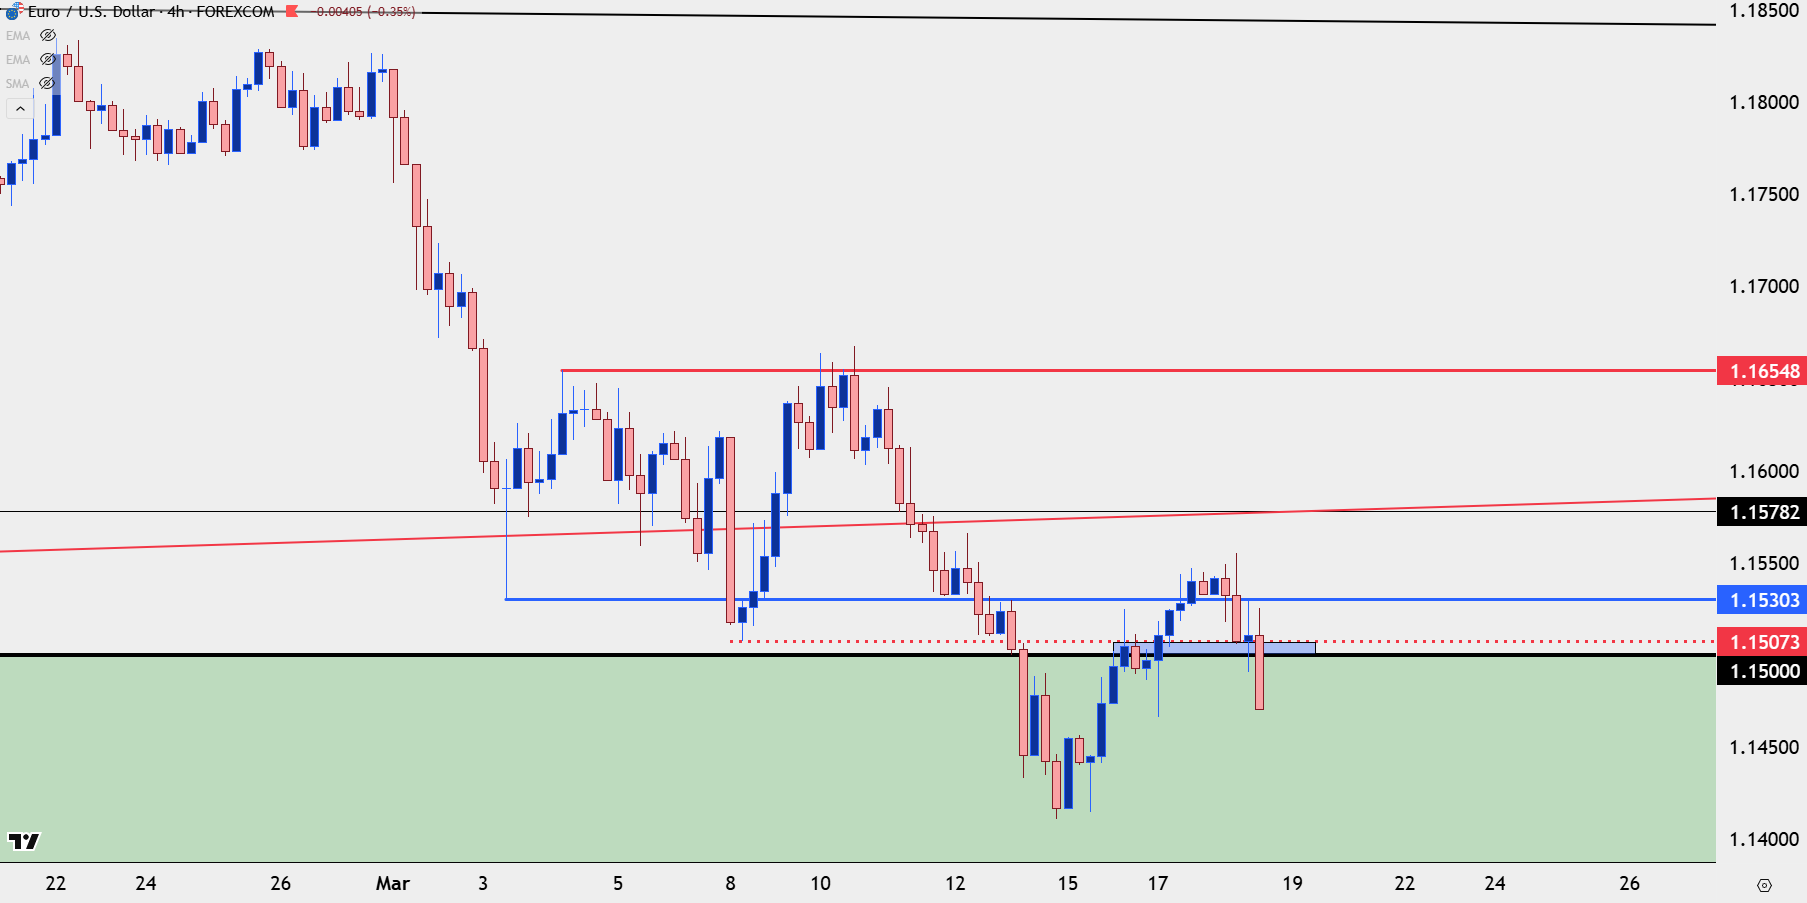
Chart prepared by James Stanley; data derived from Tradingview
USD/JPY
It was the late-January BoJ meeting that sent DXY spiraling deeply into oversold conditions, and that rooted from a hint from Kazuo Ueda that the BoJ might be getting more-hawkish in the not-too-distant future.
But, inflation numbers were soft in February and that removed some of that pressure, although a recent spike in oil prices threatens to upend that trend. As of this writing, USD/JPY sits at a fresh yearly high, getting closer and closer to a 160.00 test. It’s difficult to imagine that this won’t be at least partially considered by Ueda ahead of tonight’s meeting, and it should provide some motive for being balanced if not leaning more hawkish entirely.
It’s if he doesn’t that the range of scenarios widens dramatically, as that first re-test above 160.00 may draw the ire of the Japanese Finance Ministry, and given the built-in long position in the pair a pullback can very quickly take on the tone of reversal – and those ramifications can be felt across the DXY complex.
USD/JPY Weekly Chart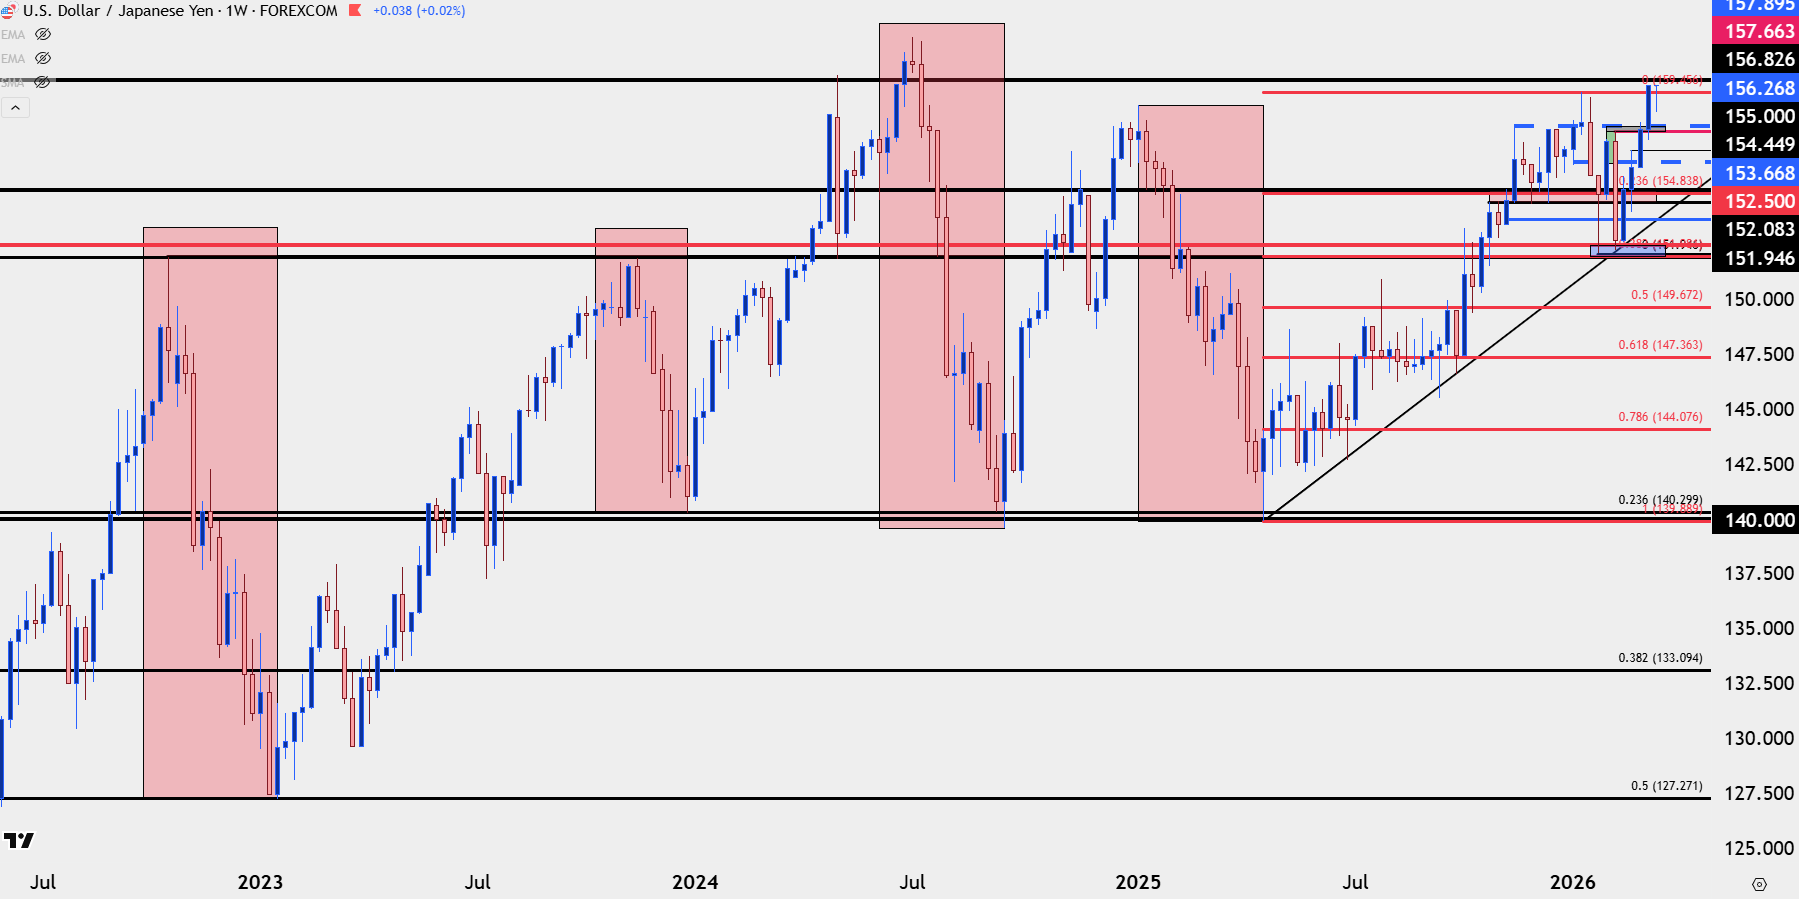
Chart prepared by James Stanley; data derived from Tradingview
--- written by James Stanley, Senior Market Analyst, Global Macro

Open an account in minutes
Experience award-winning platforms with fast and secure execution, and enjoy tight spreads from 0.5 pts on FX and 0.3 pts on indices.
Economic calendar
Web Trader platform
Our sophisticated web-based platform is packed with features.
Related articles
Gold Price Forecast: XAU/USD Avoids Breakdown as Yields Surged but Can it Continue?
Surging Treasury yields sent a jolt across markets last week but, so far, gold prices have held above the FOMC low. The big question now is whether that can continue and, if not, will bulls show up at $4100 or $4k like they did in June and July?

EUR/USD Q4 2026 Outlook: Euro at a Crossroads as Fed, ECB Tighten 9 25 2026
EUR/USD enters Q4 at a pivotal inflection point as competing Fed-ECB policy paths and persistent inflation risks collide with major technical support.


Equity Indices Q4, 2026 Outlook: Cracks Begin to Show
There's still an open door for a melt-up in the S&P 500 and Nasdaq but the Dow and Russell 2000 are looking more vulnerable, and until calm hits the Treasuries market there's a higher probability for volatility. The big question is whether that's a next quarter theme or not.
This report is intended for general circulation only. It should not be construed as a recommendation, or an offer (or solicitation of an offer) to buy or sell any financial products. The information provided does not take into account your specific investment objectives, financial situation or particular needs. Before you act on any recommendation that may be contained in this report, independent advice ought to be sought from a financial adviser regarding the suitability of the investment product, taking into account your specific investment objectives, financial situation or particular needs.
StoneX Financial Pte. Ltd., may distribute reports produced by its respective foreign entities or affiliates within the StoneX group of companies or third parties pursuant to an arrangement under Regulation 32C of the Financial Advisers Regulations. Where the report is distributed to a person in Singapore who is not an accredited investor, expert investor or an institutional investor (as defined in the Securities Futures Act), StoneX Financial Pte. Ltd. accepts legal responsibility to such persons for the contents of the report only to the extent required by law. Singapore recipients should contact StoneX Financial Pte. Ltd. at 6826 9988 for matters arising from, or in connection with the report.
In the case of all other recipients of this report, to the extent permitted by applicable laws and regulations neither StoneX Financial Pte. Ltd. nor its associated companies will be responsible or liable for any loss or damage incurred arising out of, or in connection with, any use of the information contained in this report and all such liability is hereby expressly disclaimed. No representation or warranty is made, express or implied, that the content of this report is complete or accurate.
StoneX Financial Pte. Ltd. is not under any obligation to update this report.
Trading CFDs carries a high level of risk that may not be suitable for some investors. Consider your investment objectives, level of experience, financial resources, risk appetite and other relevant circumstances carefully. The possibility exists that you could lose some or all of your investments, including your initial deposits. If in doubt, please seek independent expert advice. Visit www.forex.com/en-sg/terms-and-policies for the complete Risk Disclosure Statement.