

Last week’s open didn’t go well for equities, but for those looking to buy the dip it could’ve went much worse, depending on where you were looking.
I think the oil trade continues to have pull in equities but the weekly chart of crude oil futures provides at least some hope for a stepping back of tensions as we go into the weekend. The heavy gap to start the week ended the weekly bar as a long-legged doji and this level of indecision after a massive run and gap are both items that can be followed by mean reversion and a calming of tensions, although it may not happen in a straight line (just as we saw from last week’s price action).
Crude Oil Futures – Weekly Chart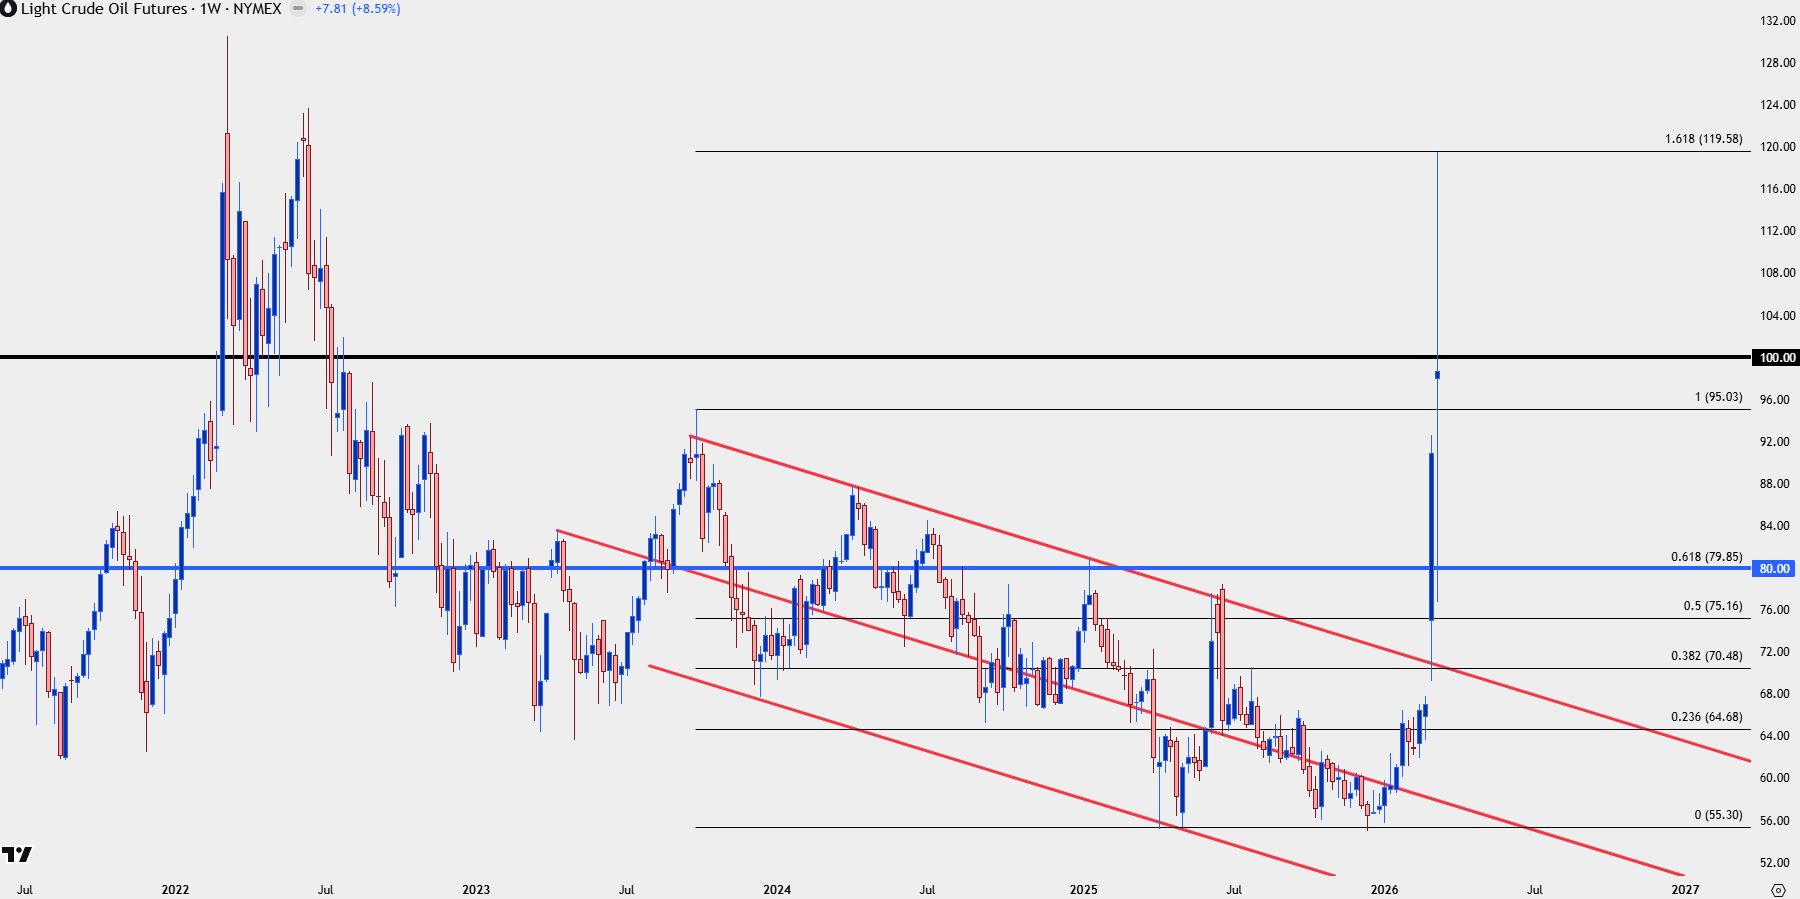
Chart prepared by James Stanley; data derived from Tradingview
Bigger picture there had grown a stronger chance of a rotation theme as we came into the year, with the Nasdaq pulling back and refraining from the October high while the Dow Jones and Russell 2000 indexes showed considerably more strength. In SPX, it was more about the fight with the 7k psychological level – which remains of issue today – but from the dynamics last week there’s actually a bit of a silver lining, in that investors used that pullback to bid names like NVDIA, Tesla and AMD, which all finished in the green for the week.
Given how strong those stocks had run since the 2022 lows as the AI trade had taken over, it made sense for a bit of lag to develop as flows sought value in areas of the market that hadn’t kept pace, like small cap stocks. But that rotation isn’t necessarily a ‘great thing’ for future forecasts as a shunning of the leaders can lead to a larger-scale sell-off.
But after the violent gap in oil prices to start the week the Nasdaq 100 re-tested a pivotal area of support which, so far, has held. This is around the 24k level and it was a level I had looked at in the 2025 Forecast for equities, which you can acquire in full from the link below:
The weekly chart below illustrates well the importance of this price, as it was resistance during the rally and what was at the time a fresh ATH last year, but it came in as support in November following the sell-off after the FOMC meeting in late-October. That spot has so far held another low and the weekly bar is taking on an indecisive shape, further illustrating how that line-in-the-sand has so far held bears at bay.
Nasdaq 100 Weekly Chart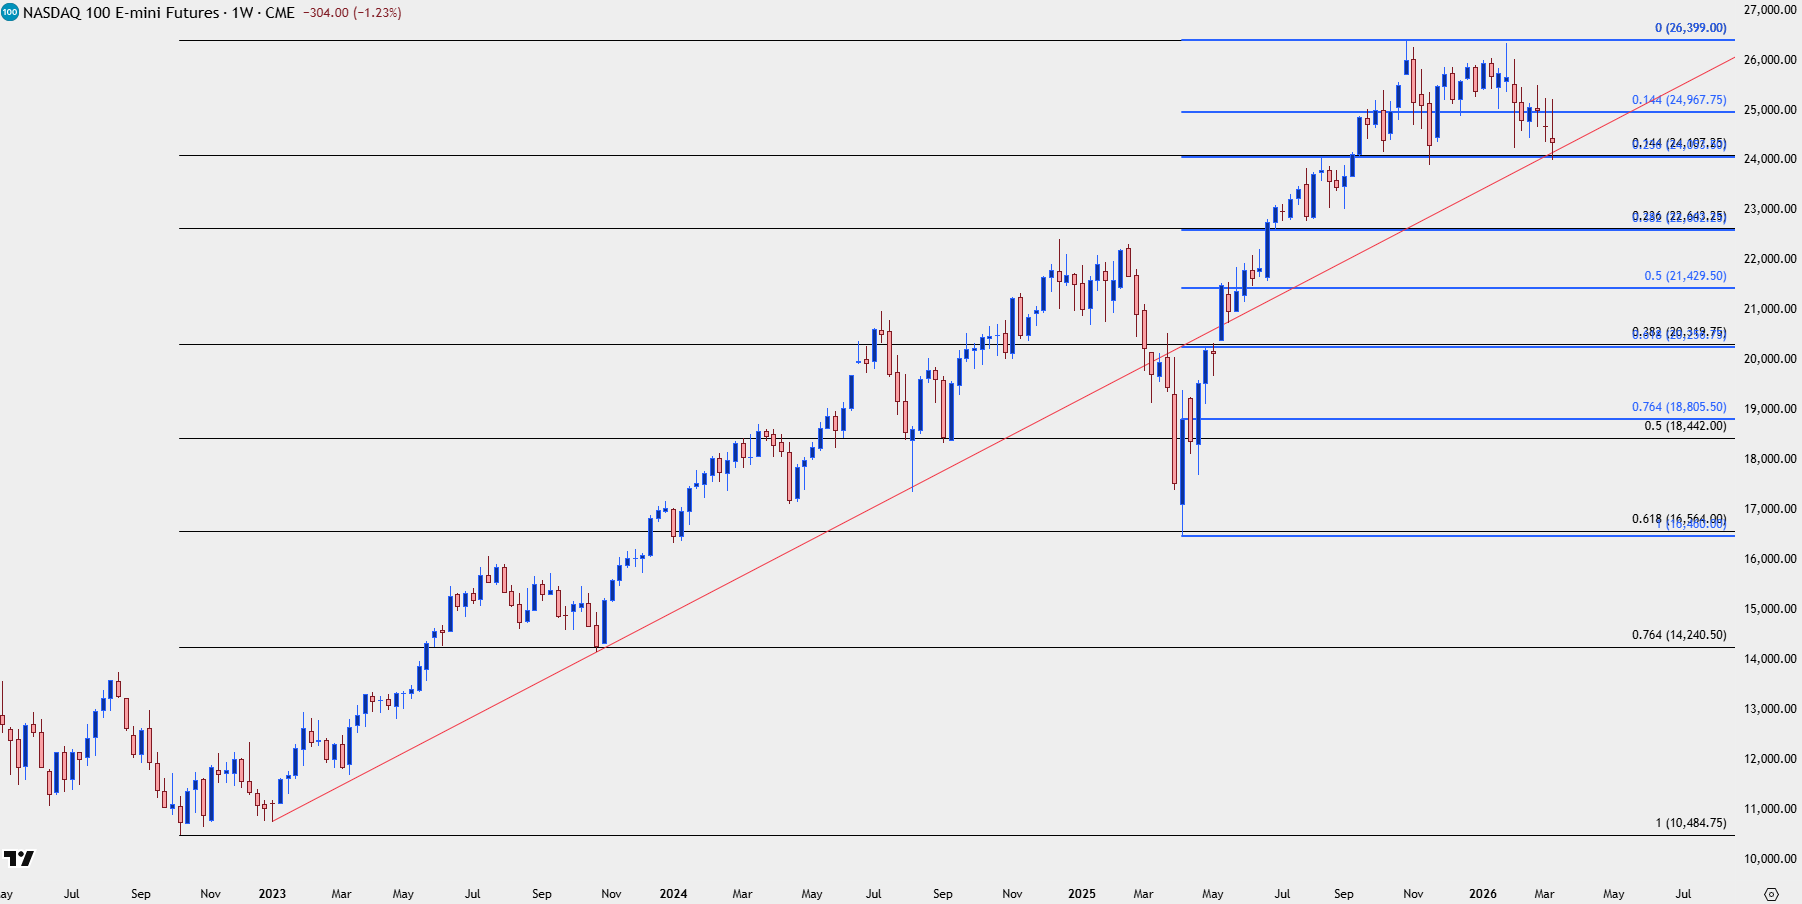
Chart prepared by James Stanley; data derived from Tradingview
Nasdaq 100
From a strategy perspective key support is fairly clear. Execution is another challenge altogether, however, as the Monday bounce was faded into the end of the week and as we work towards the weekly close sellers are continuing to push.
Also of note is what’s behind the push, with fear around oil prices prodding much of the drive. So, for next week, a probe and reaction at 24k can be seen as another opportunity to bid support. If that breaks, matters can get ugly quickly. But on the resistance side of the coin it’s the 25k level that was a tough spot for bulls to break last week and that would be an ideal level to look to for initial resistance, with 25,465 sitting above that.
Nasdaq 100 Daily Chart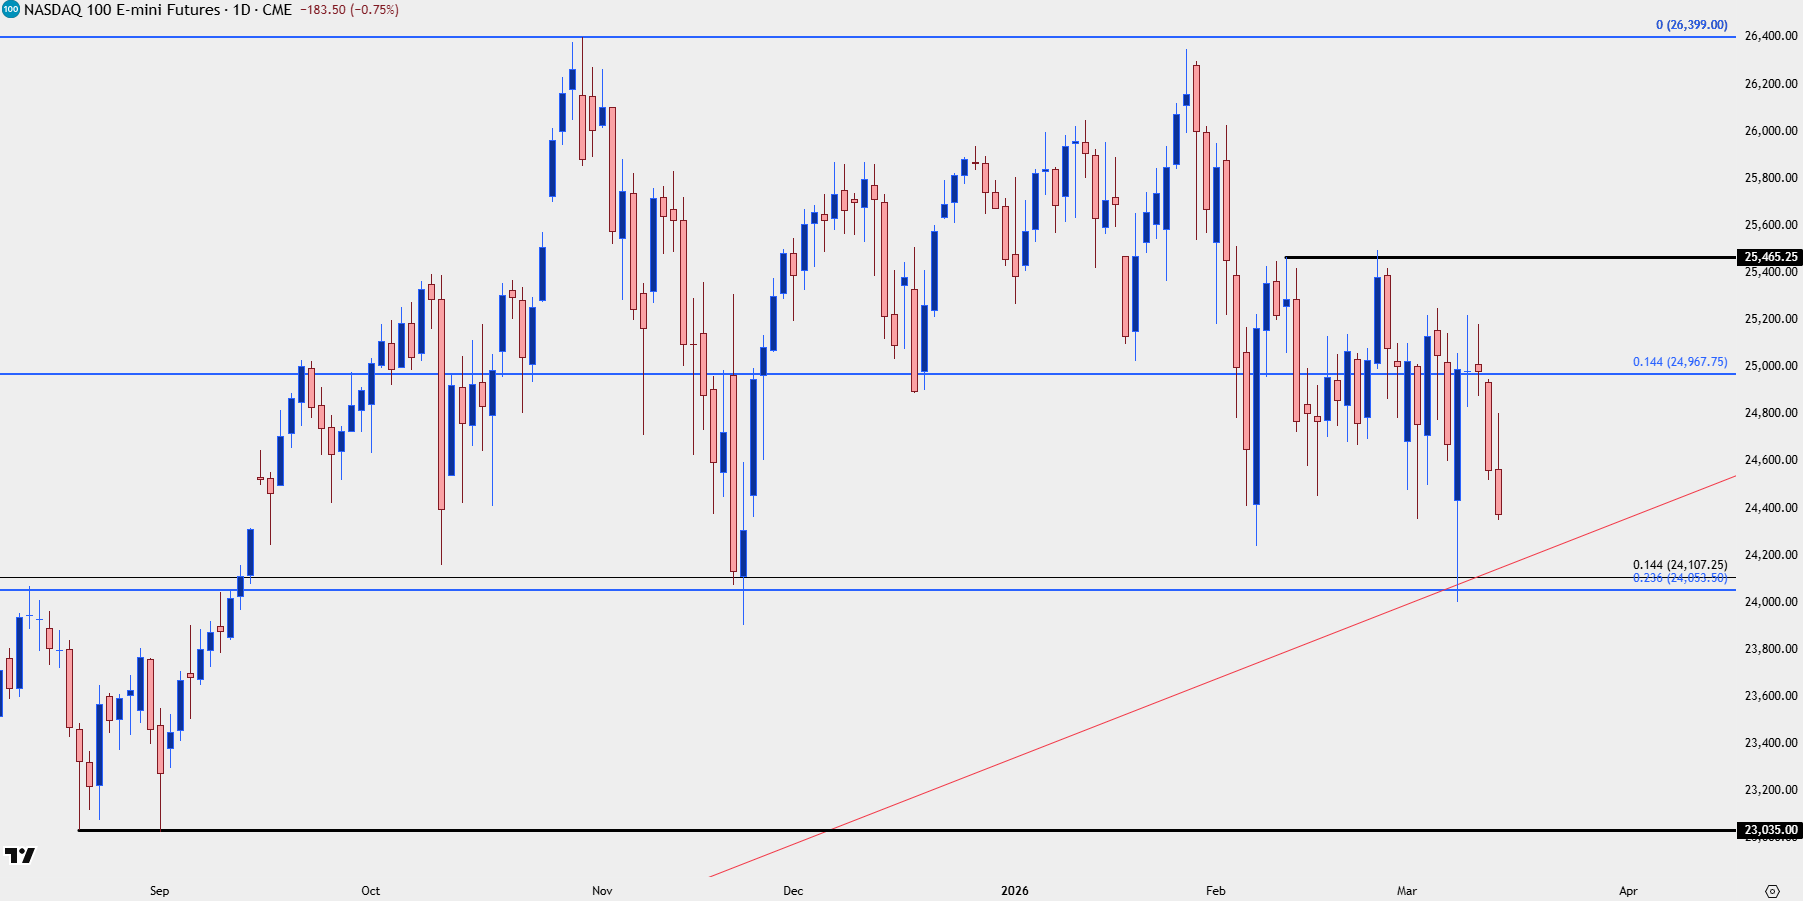
Chart prepared by James Stanley; data derived from Tradingview
SPX
The weekly bar of SPX looks less attractive than Nasdaq 100 futures above and the intra-week reversal combined with sellers finishing it in the red give the appearance that downside continuation can remain in order through the open next week.
With that said, we’re fast nearing a big spot of support potential around 6500-6550 and this similarly held the November low like the 24k level in NQ above, but this hasn’t been tested since, after the index tried and failed to leave the 7k level behind.
If that zone fails, there’s a massive spot of importance from 6145-6200 and that’s where bullish reversal potential would appear upon stalls in that zone.
Both areas were covered in the 2025 Forecast for Equities.
SPX Weekly Price Chart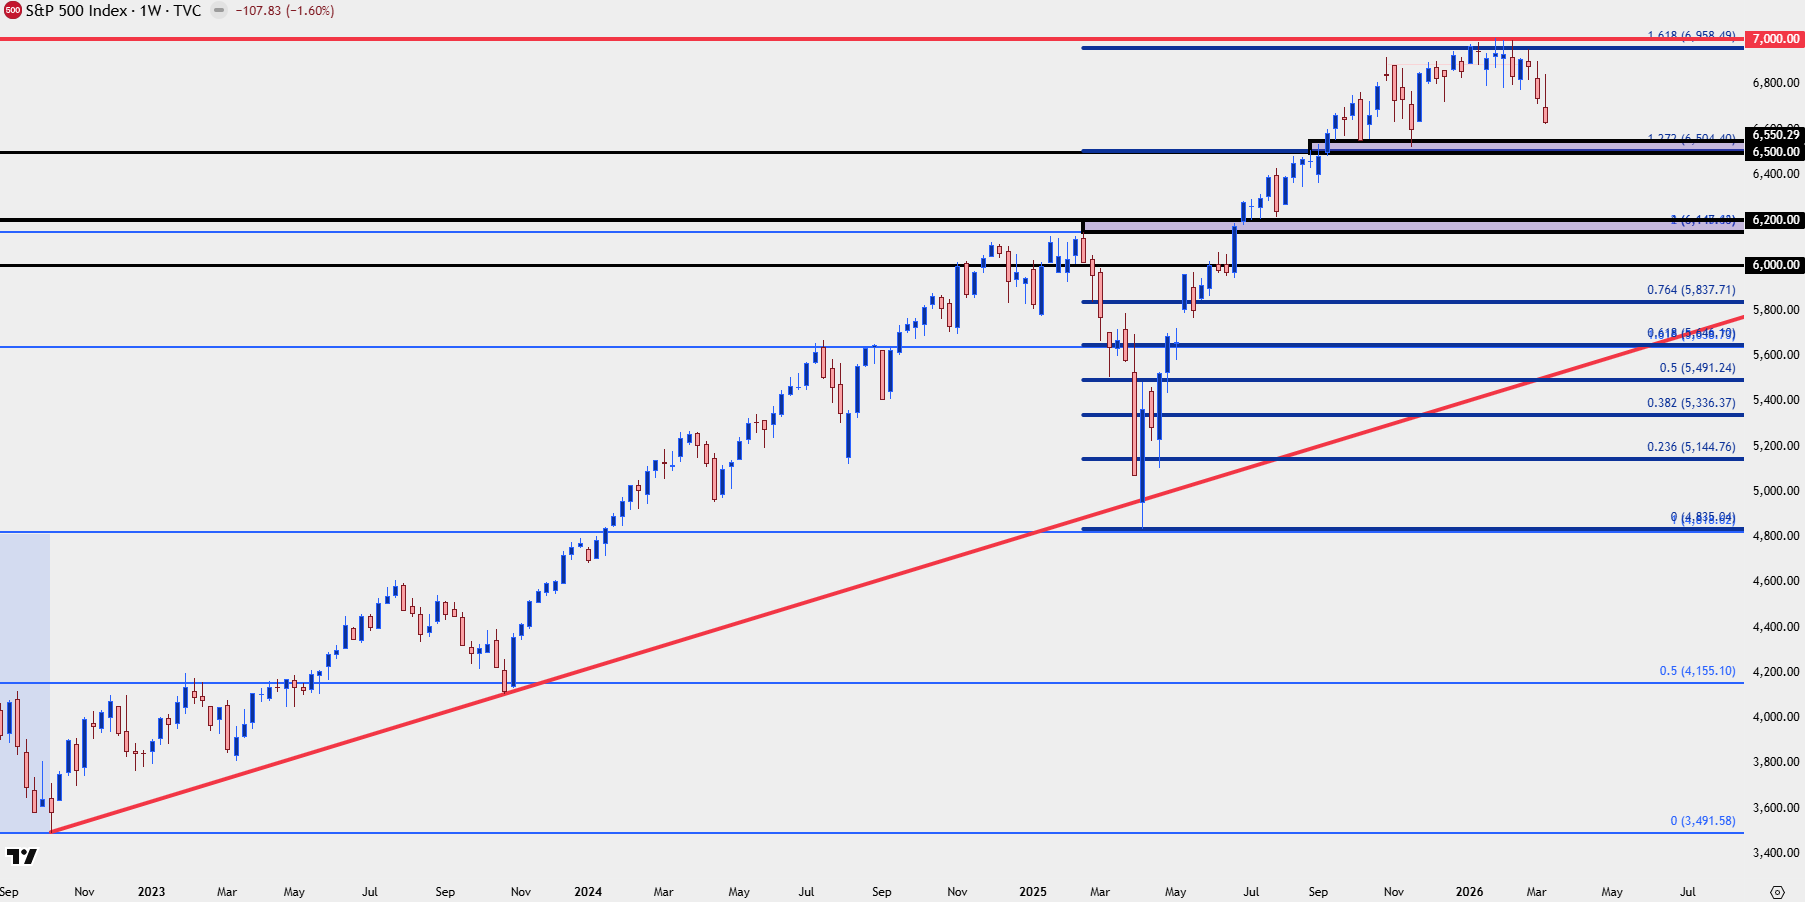
Chart prepared by James Stanley; data derived from Tradingview
The Dow
The three-week sell-off in the Dow doesn’t yet look to be finished and I’d be more careful with pushing for strength here. With that said, the 45k level was a major spot on the way up as it had held two different shots of resistance before becoming support-turned-resistance last year.
A continued fall in the index could present bullish reversal potential from that level so if we end up in a scenario where the Nasdaq breaks 24k and SPX pushes through 6500, this 45k support test in the Dow may be one of the more attractive counter-trend setups in US equities.
Dow Jones Weekly Chart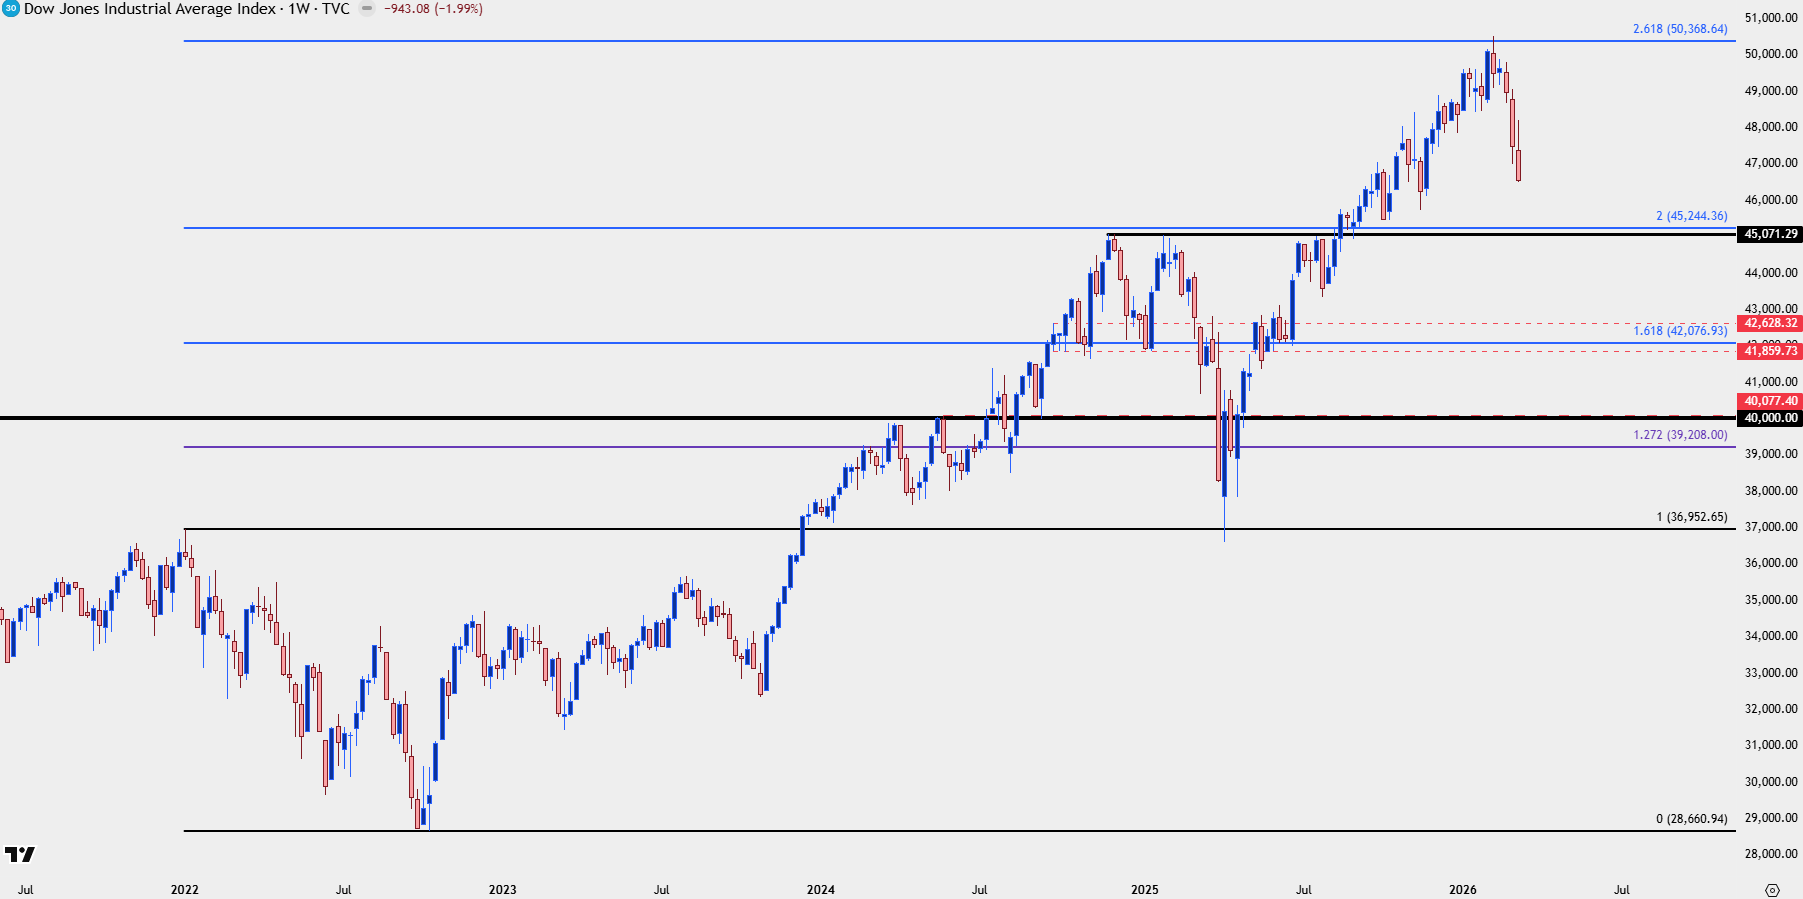
Chart prepared by James Stanley; data derived from Tradingview
Russell 2000
The Russell 2000 has similarities to each of the above in that the recent sell-off has been harsh like in the Dow or S&P 500, but the underside wick on the weekly illustrates a response from buyers at a key area that can be seen as a show of support.
In the Russell 2000 this was a level that I was looking at as a key zone a few weeks ago, with 2460-2500 marking an important line in the sand. That was tested last week – and buyers have so far showed up to hold the weekly low above the bottom of that zone giving the appearance of bounce potential.
If we do see a calming in tensions and a pullback in oil, this setup can be quite attractive given where and how bulls have shown up in response to the pullback so far.
Russell 2000 Weekly Chart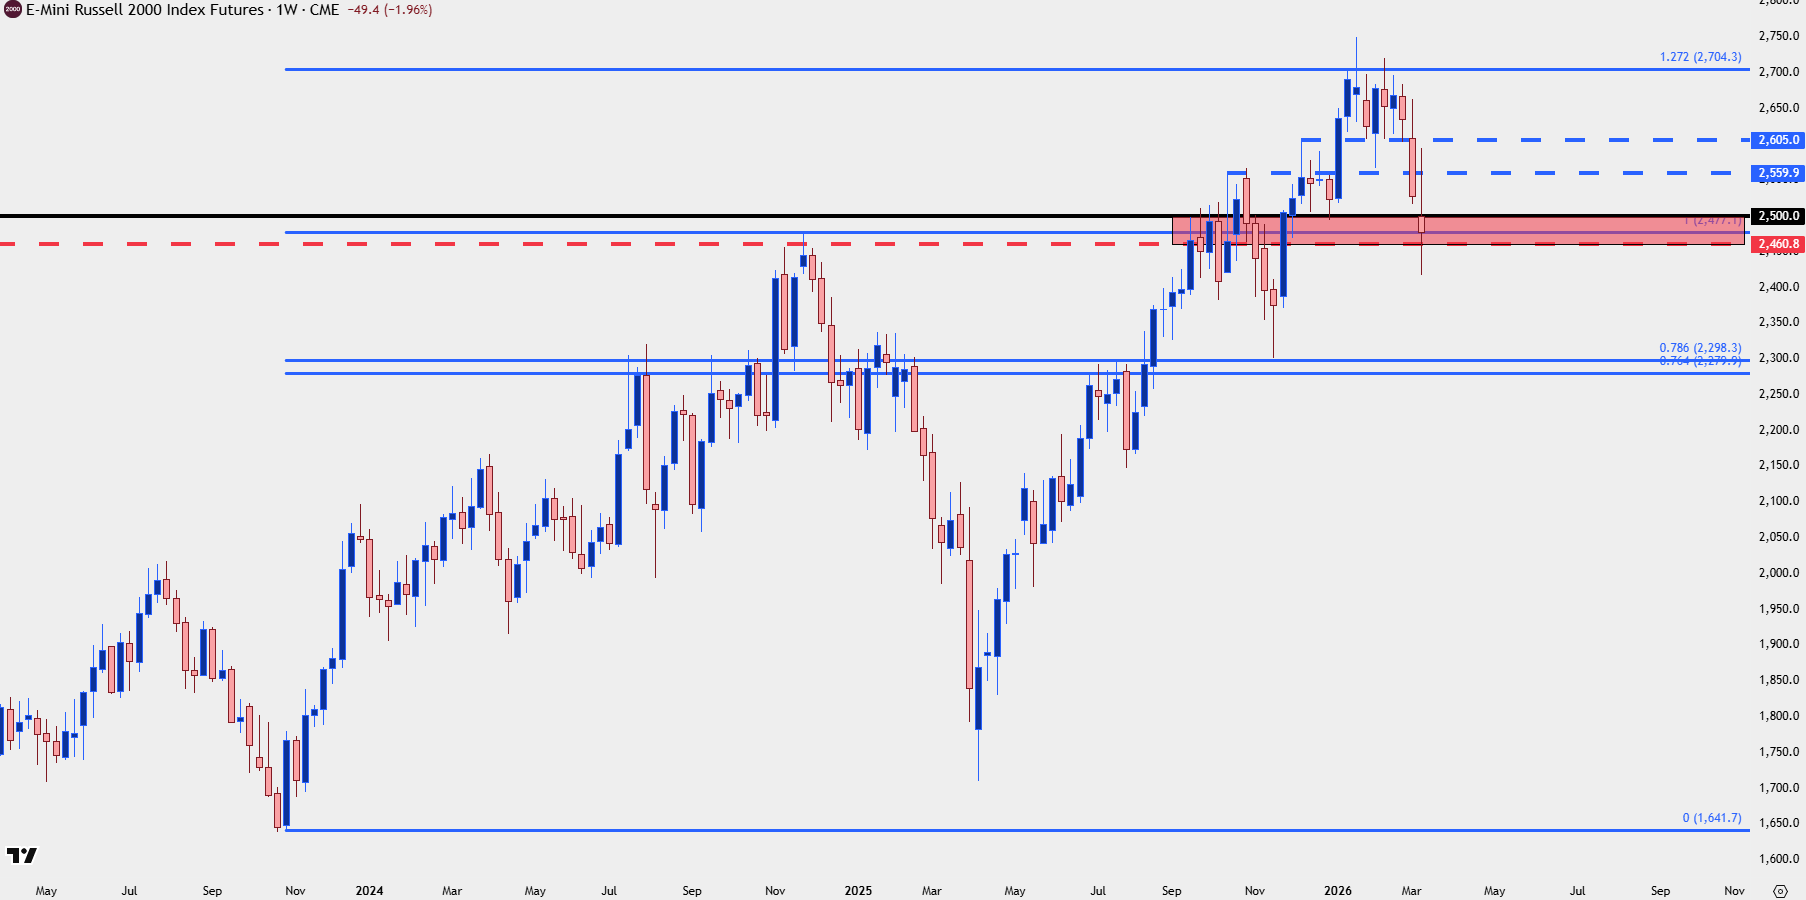
Chart prepared by James Stanley; data derived from Tradingview
--- written by James Stanley, Senior Market Analyst, Global Macro