The rising tide has receded a bit…
While that cliché is often associated with shared progress in this scenario it’s more akin to rising water levels threatening to create more problems.
It would be hard to call what’s happened over the past two weeks a shock and it certainly wouldn’t fit the description of a ‘black swan’ but the fast and violent rise in oil prices has served to unsettle several macro markets over the past two weeks and going by this week’s open, there was a chance that US equities could do something they haven’t done in almost a year when prices were sliding on the back of ‘Liberation day’ tariffs.
But this current run in oil does have some surprise, as we’ve seen daily RSI run above the 90-level, and that’s an exceptional circumstance, as the only other prior instance of that I could find goes back to August of 1990, when President Trump (the first one) was sending American troops in Saudi Arabia. This marked the start of an era, if you will, which continues to push volatility into markets almost 40 years later.
But, so far, the scenario has taken a step back as grumblings of SPR release have allayed worries of supply vulnerability from the Strait of Hormuz. That opening gap-and-go is now showing as a massive upper wick on both the daily and weekly crude oil candle and it’s still too early to call this for either direction but an intra-bar reversal of this nature can often carry with it follow-through.
Perhaps more interesting is where that high point came into play earlier this morning. In WTI crude oil futures the high this morning was just a dime away from the 161.8% extension of the 2023-2025 move in oil. And that prior 2023 high is now showing as a point of short-term support.
WTI Crude Oil Weekly Price Chart
Chart prepared by James Stanley; data derived from Tradingview
SPR Release: President Trump’s Carrot
Since his inauguration a year ago President Trump has shown at multiple times his desire to keep US equity markets roaring, and the reaction that we’ve seen so far to the rumor of an SPR release gives him a valuable carrot to dangle in front of markets to keep equities from going deeper into meltdown. And if there is a slowing in tensions in the Middle East that can further contribute to a greater degree of calm and normalcy in crude oil prices.
This would be a tough market to chase-higher, at this point, especially given the RSI reading on the daily chart of over 90 - but for those that do want to look for continued panic there is some structure that can be argued for that as we’ve so far seen a support hit at the 95-handle, which is also the 2023 swing-high. Below that, there’s open gap from this week’s open that can further serve as support, and that can be utilized either for risk placement or for a deeper pullback.
WTI Crude Oil Daily Chart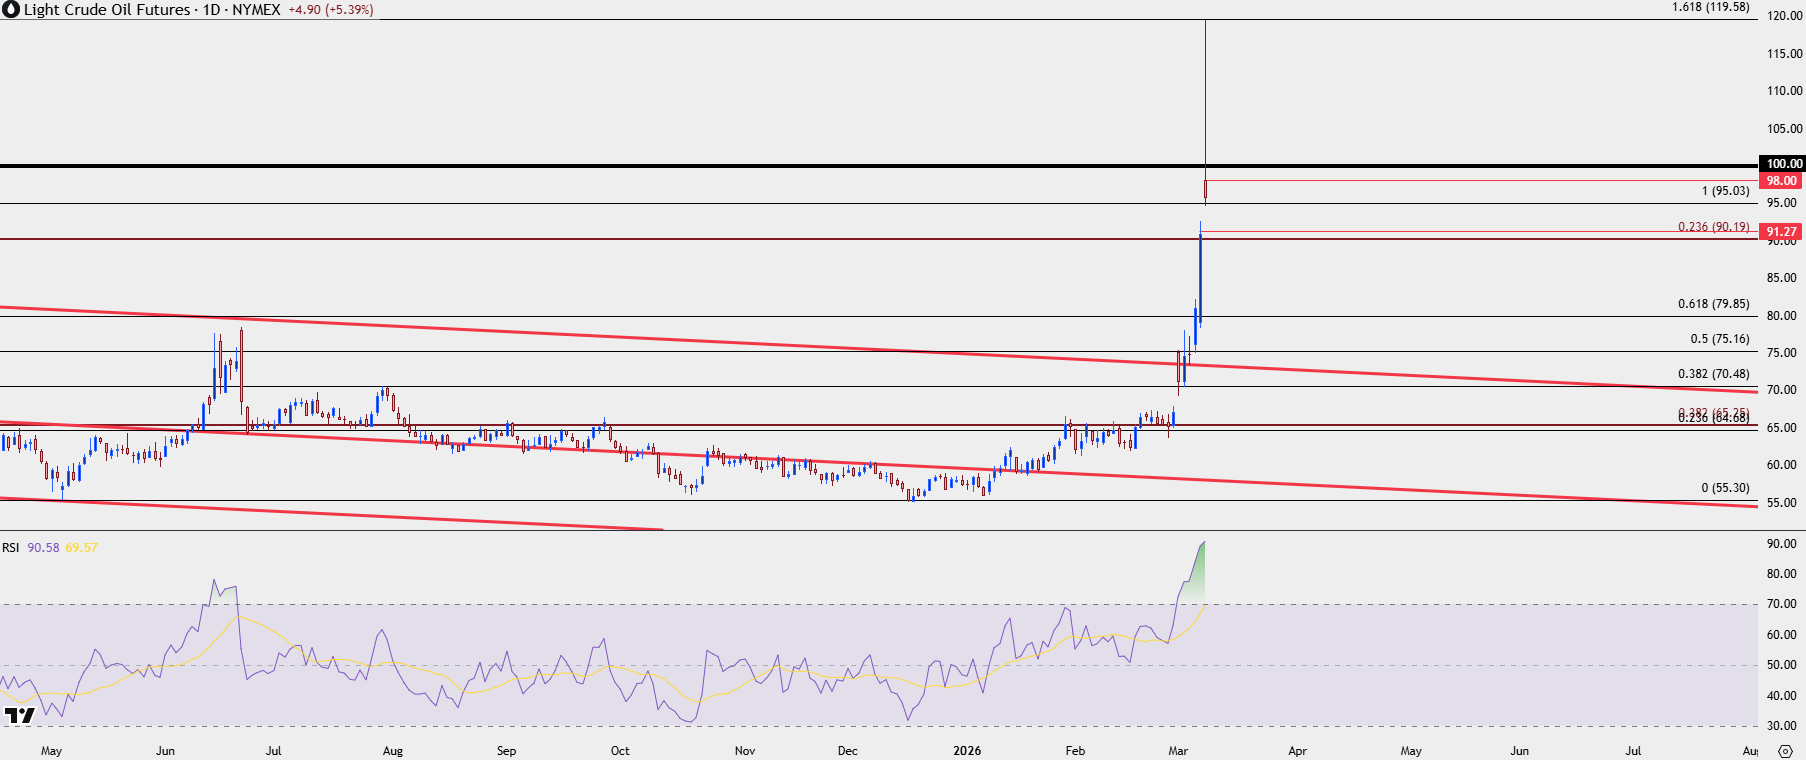
Chart prepared by James Stanley; data derived from Tradingview
Bearish Oil Scenarios
Given that we have historically overbought readings in oil combined with both the reaction and the motive behind that reaction, it would seem that there’s potential for bearish scope in oil prices.
Chasing the move-lower from the daily could be a challenge, however, given how far off we already are from that high. But – the 100 level represents a pretty important spot on the chart and this was a spot of short-term support before a lower-low presented on the hourly chart. That area now becomes a spot for a possible lower-high.
The bottom of the week’s opening gap represents next support, after which the 90-handle and the 90.19 Fibonacci level sets up.
Below that, it’s the Fibonacci level at 79.85 that’s confluent with the 80-handle that stands out, as that Fibonacci sequence is what helped to hold the high at the 161.8% projection.
Crude Oil Weekly Chart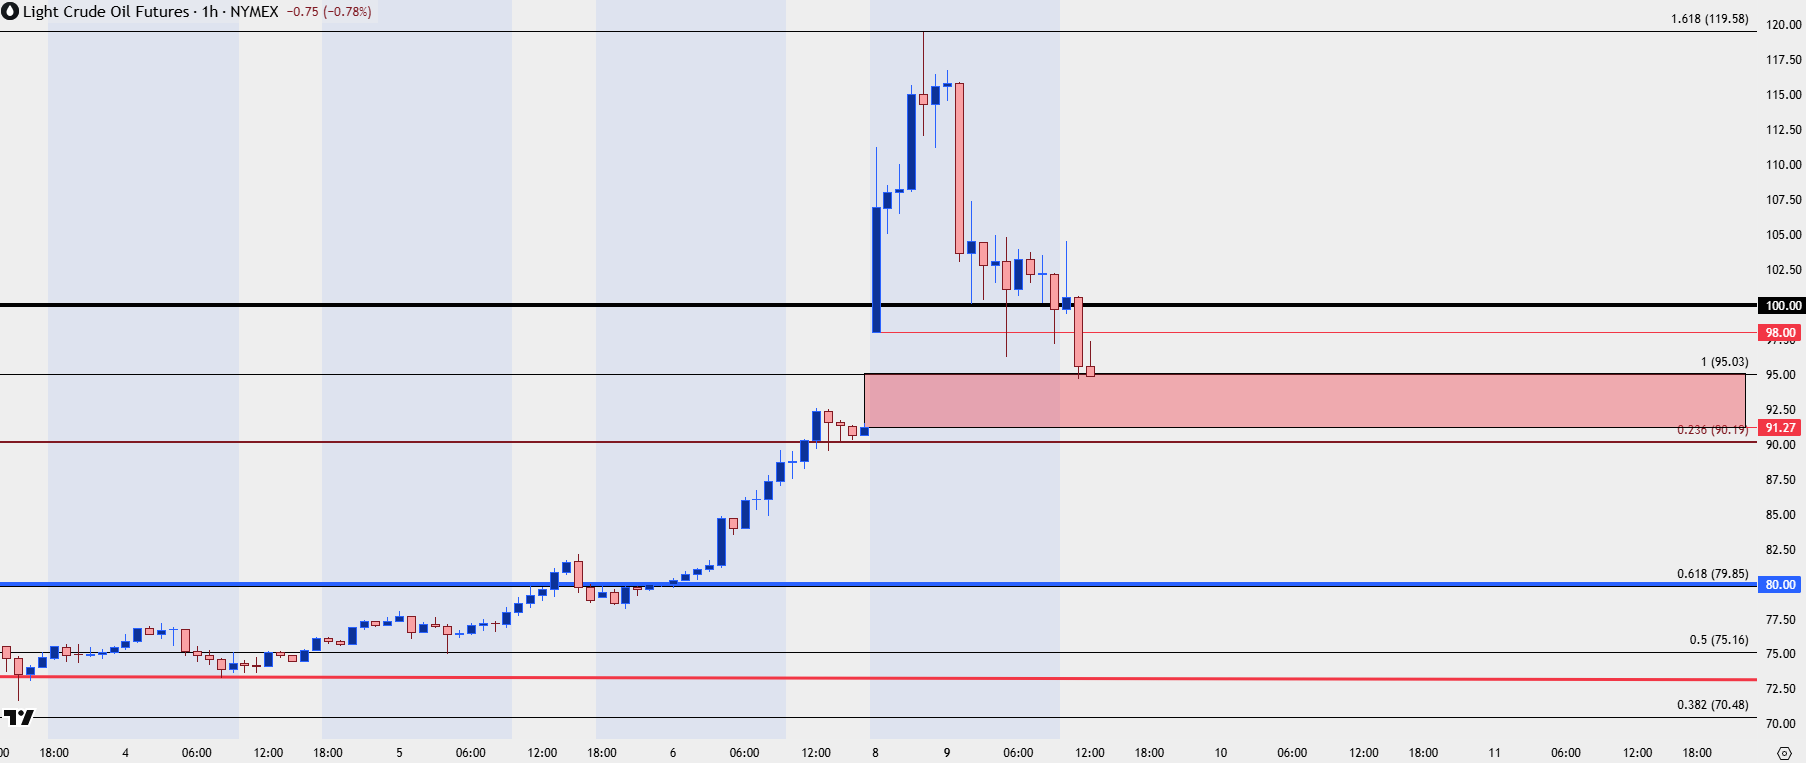
Chart prepared by James Stanley; data derived from Tradingview
--- written by James Stanley, Senior Market Analyst, Global Macro