





USDCNH Breaks Convincingly above 7
China will do whatever is necessary to reduce the collateral damage from the coronavirus.
Share this:

As we discussed last week, the coronavirus helped to cause an increase in inflation to 5.4% vs 4.9% expected, as much of the inflation was due to higher food prices. Yesterday, China released data suggesting they have been flooding the market with liquidity, trying to keep the economy afloat while also trying to navigate through this natural disaster. New Yuan loans for January increased to CNY 3340B vs CNY 3000B expected and CNY 1140B last!! In addition, Total Social Financing for January increased to CNY 5070B vs CNY 4300B expected and CNY 2103B last! The amount of new funds provided in January was almost double the amount from December. This should have been a major bullish sign to the markets, indicating that China was willing to do what was necessary to reduce the collateral damage from the slowdown of the coronavirus. USD/CNH was up .44% yesterday, although stocks markets weren’t impressed.
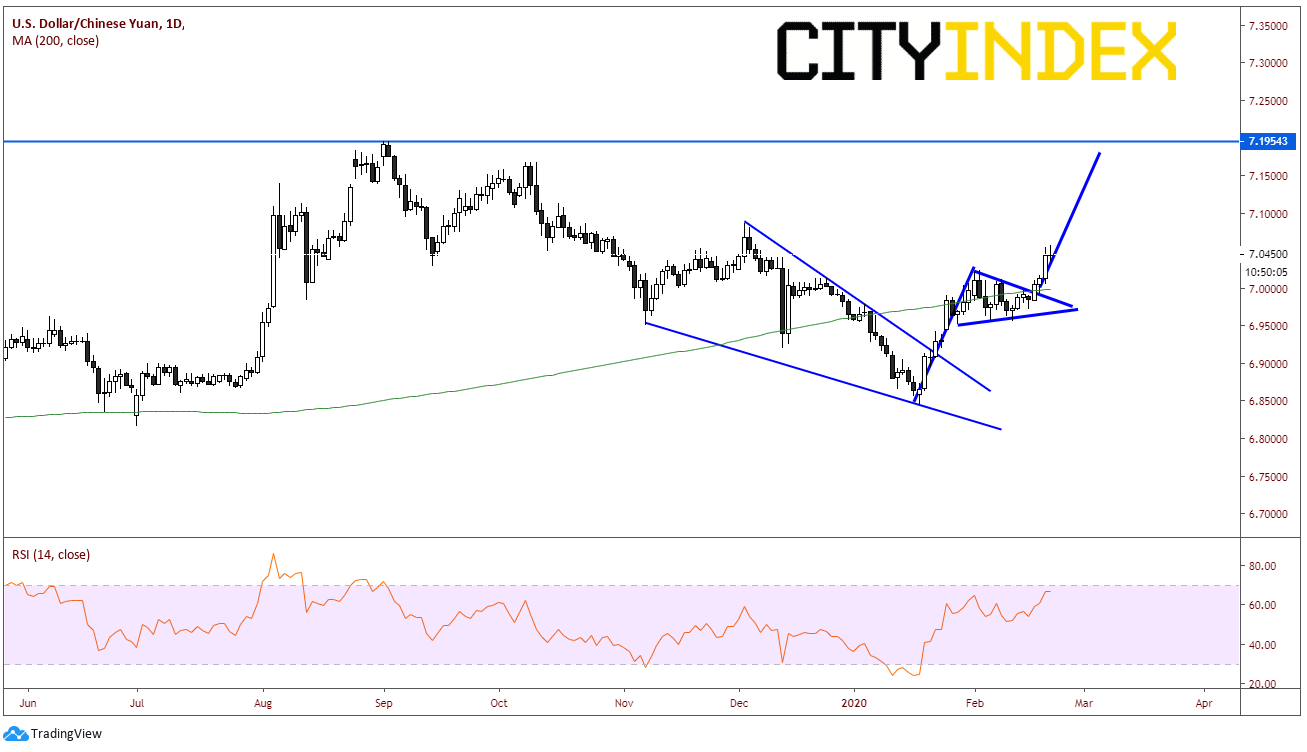
Technically, the move higher in USD/CNH was foreshadowed by a pennant formation dating back to the hammer bottom on January 20th. On January 22nd, price broke higher out of falling wedge. The target for a falling wedge is a 100% retracement of the wedge, which is near 7.0850. As USD/CNH began moving higher, it stalled near the psychological 7.0000 big round number and the 200 Day Moving Average, formatting a pennant. On Tuesday, price moved higher out of the pennant, and with news of the fresh supply of funds from China yesterday, price moved convincingly higher from 7.0129 to 7.0548 (more supply weakens the price of Yuan). The target for the pennant is near 7.18, very close to the highs from September 2nd , 2019 at 7.1954.
Source: Tradingview, City Index
On a 240-minute timeframe, price is consolidating today just below the 61.8% retracement level from the highs of September 2nd, 2019 to the lows on January 20th. This level is first resistance at 7.0617. The pause in the uptrend is also allowing for the RSI to unwind back into neutral territory. Above there is horizontal resistance near 7.1131 and finally the September 2nd highs at 7.1958, which is near the target from the pennant on the daily timeframe. First support is 7.0200, which is not only the highs of the pennant pattern, but also the 50% retracement level of the entire move and very close 7.0000. Below that is support from the upper descending trendline of the flag and a downward slowing trendline dating back to mid-October 2019, near 6.9700. Although there is a small gap to be filled between 6.9385 and 6.9452, price could fall near the January 20th lows at 6.8448 if we begin to see positive developments in the coronavirus story line.
Source: Tradingview, City Index
If the coronavirus continues to spread throughout China and manufacturing remains shut down (some are saying until March 11th), USD/CNH should continue to rise and move towards the pennant target. However, if there is good news over the next few weeks, USD/CNH could be back near the January 20th lows.
As we discussed last week, the coronavirus helped to cause an increase in inflation to 5.4% vs 4.9% expected, as much of the inflation was due to higher food prices. Yesterday, China released data suggesting they have been flooding the market with liquidity, trying to keep the economy afloat while also trying to navigate through this natural disaster. New Yuan loans for January increased to CNY 3340B vs CNY 3000B expected and CNY 1140B last!! In addition, Total Social Financing for January increased to CNY 5070B vs CNY 4300B expected and CNY 2103B last! The amount of new funds provided in January was almost double the amount from December. This should have been a major bullish sign to the markets, indicating that China was willing to do what was necessary to reduce the collateral damage from the slowdown of the coronavirus. USD/CNH was up .44% yesterday, although stocks markets weren’t impressed.
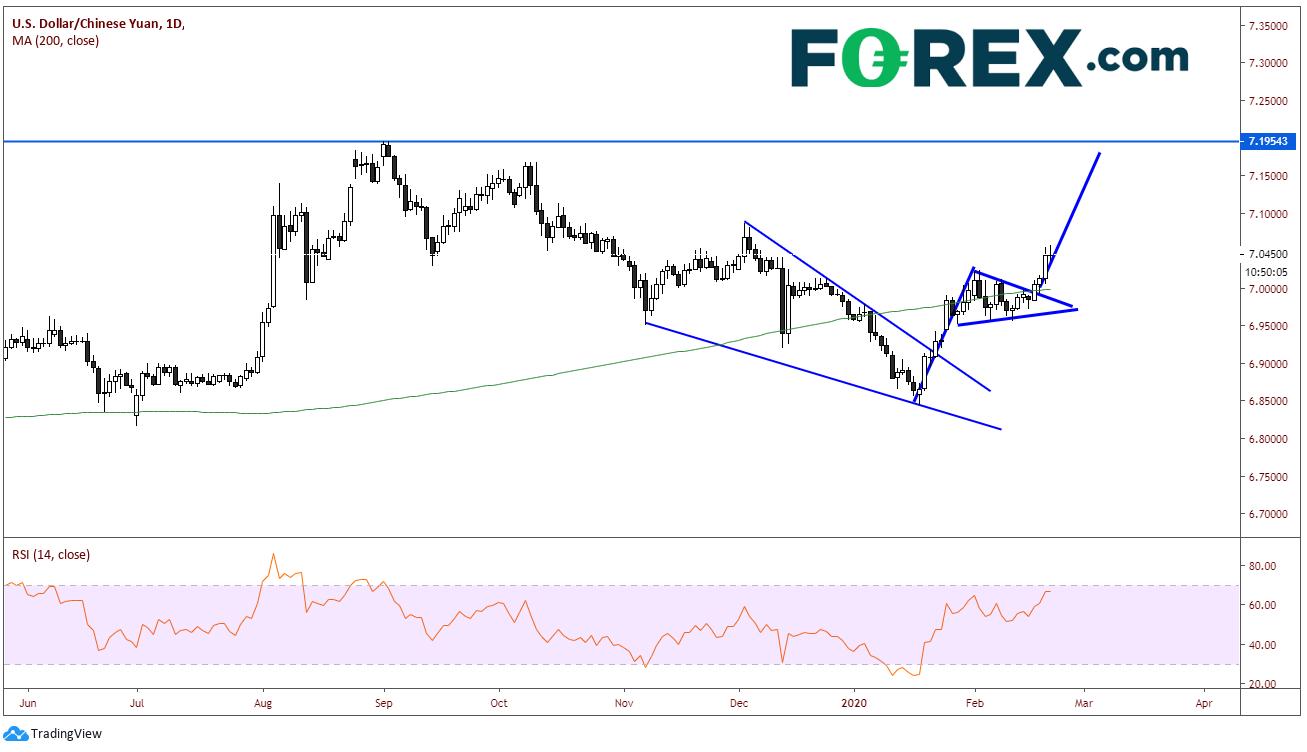
Technically, the move higher in USD/CNH was foreshadowed by a pennant formation dating back to the hammer bottom on January 20th. On January 22nd, price broke higher out of falling wedge. The target for a falling wedge is a 100% retracement of the wedge, which is near 7.0850. As USD/CNH began moving higher, it stalled near the psychological 7.0000 big round number and the 200 Day Moving Average, formatting a pennant. On Tuesday, price moved higher out of the pennant, and with news of the fresh supply of funds from China yesterday, price moved convincingly higher from 7.0129 to 7.0548 (more supply weakens the price of Yuan). The target for the pennant is near 7.18, very close to the highs from September 2nd , 2019 at 7.1954.
Source: Tradingview, FOREX.COM
On a 240-minute timeframe, price is consolidating today just below the 61.8% retracement level from the highs of September 2nd, 2019 to the lows on January 20th. This level is first resistance at 7.0617. The pause in the uptrend is also allowing for the RSI to unwind back into neutral territory. Above there is horizontal resistance near 7.1131 and finally the September 2nd highs at 7.1958, which is near the target from the pennant on the daily timeframe. First support is 7.0200, which is not only the highs of the pennant pattern, but also the 50% retracement level of the entire move and very close 7.0000. Below that is support from the upper descending trendline of the flag and a downward slowing trendline dating back to mid-October 2019, near 6.9700. Although there is a small gap to be filled between 6.9385 and 6.9452, price could fall near the January 20th lows at 6.8448 if we begin to see positive developments in the coronavirus story line.
Source: Tradingview, FOREX.COM
If the coronavirus continues to spread throughout China and manufacturing remains shut down (some are saying until March 11th), USD/CNH should continue to rise and move towards the pennant target. However, if there is good news over the next few weeks, USD/CNH could be back near the January 20th lows.


Open an account in minutes
Experience award-winning platforms with fast and secure execution, and enjoy tight spreads from 0.5 pts on FX and 0.3 pts on indices.
Economic calendar
Web Trader platform
Our sophisticated web-based platform is packed with features.
Related articles
NZD/USD pressure mounts as payrolls looms large
NZD/USD has fallen sharply as Fed rate expectations reset higher, but extreme downside stretch and major support raise the risk of a violent counter-trend rebound.

US Core PCE Preview: Stale or Significant for the Fed
Core PCE inflation takes center stage Wednesday, with traders watching for signs of renewed price pressure and clues on whether the Fed could hike again in October.


Australian Dollar Forecast: AUD/USD Four-Week Slide Nears Critical Uptrend Support 9 29 2026
Aussie momentum has deteriorated sharply into quarter-end, with inflation, Core PCE and NFP on tap as AUD/USD closes in on a pivotal technical threshold.

This report is intended for general circulation only. It should not be construed as a recommendation, or an offer (or solicitation of an offer) to buy or sell any financial products. The information provided does not take into account your specific investment objectives, financial situation or particular needs. Before you act on any recommendation that may be contained in this report, independent advice ought to be sought from a financial adviser regarding the suitability of the investment product, taking into account your specific investment objectives, financial situation or particular needs.
StoneX Financial Pte. Ltd., may distribute reports produced by its respective foreign entities or affiliates within the StoneX group of companies or third parties pursuant to an arrangement under Regulation 32C of the Financial Advisers Regulations. Where the report is distributed to a person in Singapore who is not an accredited investor, expert investor or an institutional investor (as defined in the Securities Futures Act), StoneX Financial Pte. Ltd. accepts legal responsibility to such persons for the contents of the report only to the extent required by law. Singapore recipients should contact StoneX Financial Pte. Ltd. at 6826 9988 for matters arising from, or in connection with the report.
In the case of all other recipients of this report, to the extent permitted by applicable laws and regulations neither StoneX Financial Pte. Ltd. nor its associated companies will be responsible or liable for any loss or damage incurred arising out of, or in connection with, any use of the information contained in this report and all such liability is hereby expressly disclaimed. No representation or warranty is made, express or implied, that the content of this report is complete or accurate.
StoneX Financial Pte. Ltd. is not under any obligation to update this report.
Trading CFDs carries a high level of risk that may not be suitable for some investors. Consider your investment objectives, level of experience, financial resources, risk appetite and other relevant circumstances carefully. The possibility exists that you could lose some or all of your investments, including your initial deposits. If in doubt, please seek independent expert advice. Visit www.forex.com/en-sg/terms-and-policies for the complete Risk Disclosure Statement.