



USD/JPY Analysis: Asian Open – 25th July 2023
USD/JPY has snapped a 5-day winning streak and formed a bearish inside day ahead of this week's FOMC meeting, suggesting that range-trading strategies may be preferred for intraday traders.
Share this:

Market Summary:
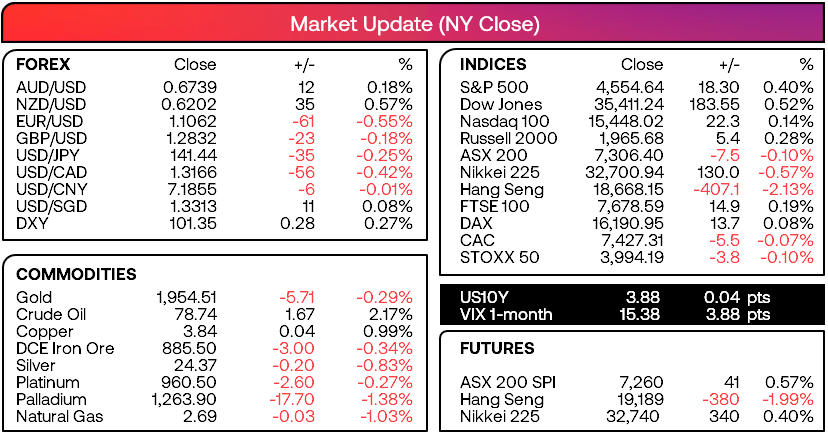
- EUR/USD was the weakest FX major overnight thanks the underperformance of the eurozone’s PMI surveys
- Manufacturing in Germany and the eurozone contracted at their fastest pace in over three years, expansion for service was its slowest in five months which saw the eurozone composite contract for a second month.
- That said, easing price pressures will be welcomed by the ECB even if the dire figures have reignited recession fears. Whilst it remains likely the ECB will hike rates by 25bp this week, it brings serious doubt as to whether they will hike again in September
- The general theme for PMIs points to underlying weakness for growth, with UK output falling to a 6-month low, US output hitting a 5-month low and data, Australia’s output contracting at its fastest pace in seven months
- Japan’s composite output (service and manufacturing combined) remained flat at 52.1, with S&P Global warning that inflation could remain “sticky’ for a while longer
- Commodity prices are rising on supply concerns following weekend reports of India banning rice exports to fight domestic inflation and Russia’s attacks on Ukraine ports, fanning fears of supply chain disruptions and rising food inflation
- The Thomson Reuters CRB commodities index has risen to a seven-week high and broken out of a multi-month continuation pattern, undermines any hopes of deflation going forward if the rally persists
- WTI crude oil rose to a 3-month high and tagged $79
- Market participants expect the BOC to hold rates at 5% until their first cut in March according to a BOC (Bank of Canada) survey
Events in focus (AEDT):
- 09:00 – Bank of Japan’s core CPI
- 18:00 – German Ifo business sentiment

Technically Speaking:
- The Dow Jones (DJI) rose for an 11th consecutive day, a bullish sequence not seen since Feb 2017 (when it managed to rise for 12 days before
- The US dollar index rose for a fifth day, but met resistance at its 20-day EMA
- USD/JPY printed a hanging man candle on the daily chart which is also an inside day. It likey points to another day or two of range-trading given the pending FOMC meeting.
- The China A50 posted a strong bullish candle at 12,400 – a level that has held despite four tests of it since late June.. We continue to look for an upside break of its bearish channel given its reluctance to fall despite weak economic data from China.
- NZD/USD snapped a 6-day losing streak and found support above 0.6150. However, we’d prefer to see a break above the 200-dy EMA !0.6225 before assuming any decent follow through.
- USD/CNH is coiling up on the daily chart. Whilst its next directional move remains to be seen, it could suggest that pressure is building for its next burst of volatility (FOMC a likely trigger?)
- AUD/NZD printed a bearish engulfing day at 1.0900 resistance. We’re happy to step aside for now as target was met last week, and reassess its potential for a move to 1.10 if a higher low presents itself.
ASX 200 at a glance:
- We expected volatility to be lower on the ASX 200, yet its lacklustre performance has still come as a surprise
- Its daily range was the lowest in 38 days and closed just -7.5 points lower
- Such small ranges are difficult even for day traders to profit from, sometimes it is best to step aside and wait for volatility (and a more obvious implied direction) to return
- If we see a hawkish Fed hike, it could weigh on equity sentiment in general and provide the opportunity for a pullback towards 7200 as a minimum
- We’d need to see a decent break (or daily close) above 7400 before we can assume a resumption of its prior bullish move


USD/JPY 1-hour chart:
Price action may remain on the tricky side with the FOMC meeting less than 48 hours away. Therefore, traders may want to focus on lower timeframes to capture smaller moves unless we are provided with a fresh market-moving catalyst.
USD/JPY has posted a 3.5% rally over 5 days ahead of yesterday’s inside day (which is also a hanging man reversal). I’m making the assumption prices will remain within yesterday’s range, at leas through the Asian session. Whilst a nice trend has formed on the 4 and 1-hour charts, volumes increased during the recent log lower then fell as prices advanced. This suggests it may want to move lower, which brings the 141 handle into focus. If we see a pullback lower, then perhaps we can seek bullish opportunities around the 141 handle or 20-bar EMA, and retain a bullish bias whilst prices remain above Mondays low. Alternatively, bears could wait for signs of weakness beneath or around Monday’s high. The key point here is that trades appear unfavourable around the middle of the range following an inside day, hence the range-trading approach (bullish around support, bearish around resistance).


-- Written by Matt Simpson
Follow Matt on Twitter @cLeverEdge
How to trade with City Index
You can trade with City Index by following these four easy steps:
- Open an account, or log in if you’re already a customer
• Open an account in the UK
• Open an account in Australia
• Open an account in Singapore
- Search for the market you want to trade in our award-winning platform
- Choose your position and size, and your stop and limit levels
- Place the trade
Related tags:
Latest market news




Open an account in minutes
Experience award-winning platforms with fast and secure execution, and enjoy tight spreads from 0.5 pts on FX and 0.3 pts on indices.
Economic calendar
Web Trader platform
Our sophisticated web-based platform is packed with features.
Related articles
Gold Outlook: XAU/USD hit hard as US yields, dollar resume ascent
A stronger dollar, surging front-end yields and renewed geopolitical tension have combined to push gold back towards key technical support.
Australian Dollar Outlook: AUD/USD Holds 70c Ahead of RBA and CPI
AUD/USD faces an expected RBA hike and Australian CPI before attention turns to US PCE, ISM and nonfarm payrolls later in the week.
EUR/USD weekly outlook: Oil, inflation and NFP in focus
After coming under significant pressure in recent weeks, the EUR/USD came off its lows to finish the week on a positive note on Friday, albeit with only a mild rebound. That was not enough to prevent the exchange rate falling for the third consecutive week, as the US dollar and bond yields rallied across the board.

This report is intended for general circulation only. It should not be construed as a recommendation, or an offer (or solicitation of an offer) to buy or sell any financial products. The information provided does not take into account your specific investment objectives, financial situation or particular needs. Before you act on any recommendation that may be contained in this report, independent advice ought to be sought from a financial adviser regarding the suitability of the investment product, taking into account your specific investment objectives, financial situation or particular needs.
StoneX Financial Pte. Ltd., may distribute reports produced by its respective foreign entities or affiliates within the StoneX group of companies or third parties pursuant to an arrangement under Regulation 32C of the Financial Advisers Regulations. Where the report is distributed to a person in Singapore who is not an accredited investor, expert investor or an institutional investor (as defined in the Securities Futures Act), StoneX Financial Pte. Ltd. accepts legal responsibility to such persons for the contents of the report only to the extent required by law. Singapore recipients should contact StoneX Financial Pte. Ltd. at 6826 9988 for matters arising from, or in connection with the report.
In the case of all other recipients of this report, to the extent permitted by applicable laws and regulations neither StoneX Financial Pte. Ltd. nor its associated companies will be responsible or liable for any loss or damage incurred arising out of, or in connection with, any use of the information contained in this report and all such liability is hereby expressly disclaimed. No representation or warranty is made, express or implied, that the content of this report is complete or accurate.
StoneX Financial Pte. Ltd. is not under any obligation to update this report.
Trading CFDs carries a high level of risk that may not be suitable for some investors. Consider your investment objectives, level of experience, financial resources, risk appetite and other relevant circumstances carefully. The possibility exists that you could lose some or all of your investments, including your initial deposits. If in doubt, please seek independent expert advice. Visit www.forex.com/en-sg/terms-and-policies for the complete Risk Disclosure Statement.