



Australian Dollar Outlook: AUD/USD Holds 70c Ahead of RBA and CPI
AUD/USD faces an expected RBA hike and Australian CPI before attention turns to US PCE, ISM and nonfarm payrolls later in the week.
Share this:

AUD/USD enters a packed week after falling for a third consecutive week, with an expected RBA hike and Australian CPI likely to drive the early moves. Attention then turns to US PCE inflation, ISM manufacturing and nonfarm payrolls as traders reassess the Fed rate outlook.
View related analysis:
- AUD/USD Q4 Outlook: RBA and Fed Hikes Set the Tone
- AUD/USD Crushed Ahead of Jobs Report as US Dollar, Yields Surge
- Yen Bulls Bruised by BOJ, But Intervention Could Prove Them Right
- USD/JPY and USD/CHF Could Diverge as CHF/JPY Approaches Resistance
- How to Read the COT Report to Track Forex Market Sentiment
AUD/USD Faces RBA and CPI Before US Data Takes Centre Stage
The Trump-Xi summit had little to no impact on currency traders, though we did at least see a two-month extension of the US-China trade truce. But with no obvious breakthrough on Iran or Taiwan, it was a meeting focused more on stability than achievement.
While RBA commentary last week clearly leaned hawkish, making tomorrow’s RBA call a clear hike, the employment report complicated the picture somewhat. The 39.5k jobs growth was all fuelled by part-time work and hid the reduction of 6.3k full-time jobs, and the 4.6% headline unemployment could really have ben rounded up top 4.7% given it landed at 4.65%.
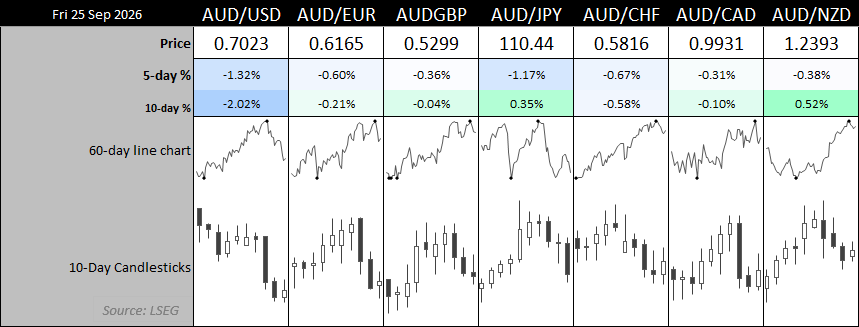
For the US, Fed officials leaned hawkish and September’s flash PMI shows business activity rose to a 5-year high. The US dollar index reached a two-month high, sending AUD/USD to just shy of 70c and down for a third week.
Australia This Week: Economic Data and Events for AUD/USD Traders
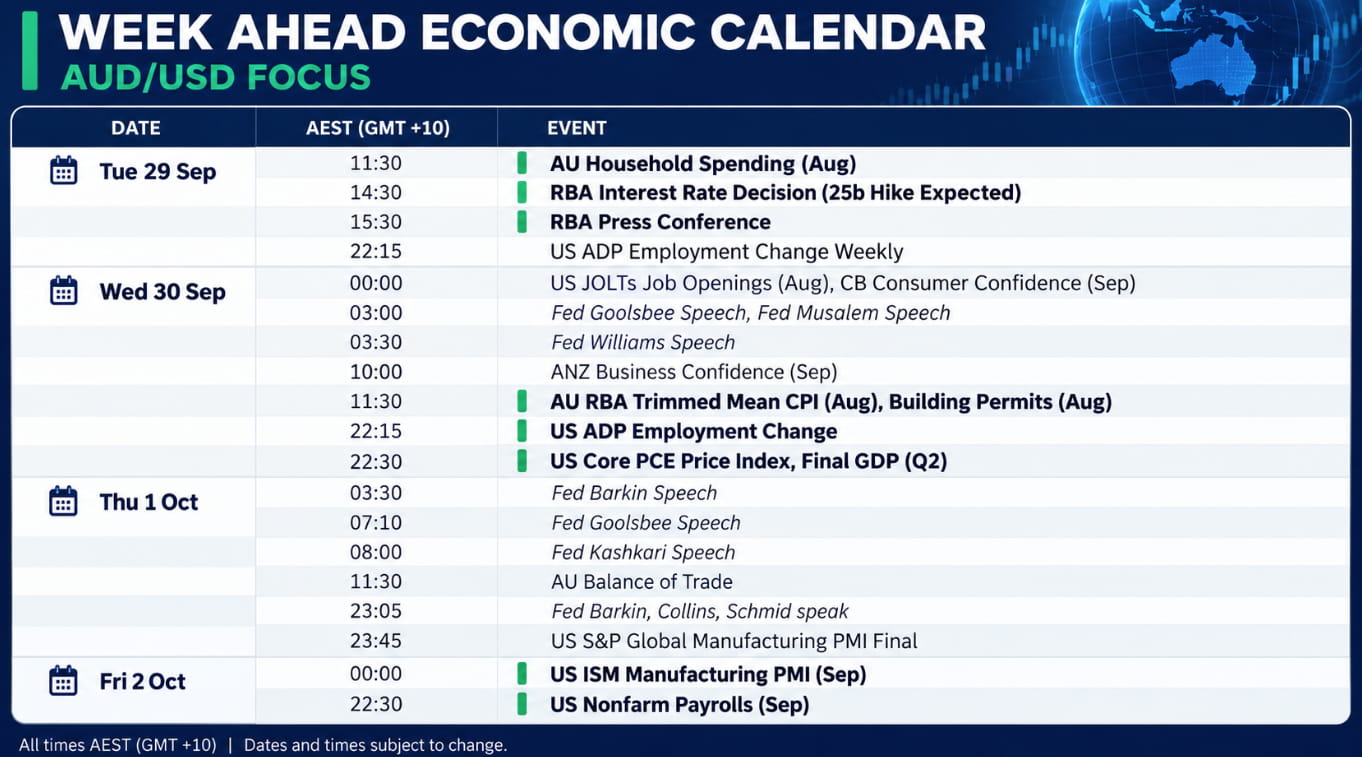
RBA Meeting and CPI Put the Australian Dollar in Focus
This is the busiest calendar I have seen in a while, with a good mix of key data between the US and Australia, with an RBA meeting thrown in for added fun. I believe it has been well established that the RBA is expected to hike by 25bp, so traders will look for policy clues in the statement and press conference.
I expect the RBA will retain the threat of further hikes without committing. Unemployment has crept up to 4.65% - which could easily be rounded up to 4.7%. And with CPI data due on Wednesday, time is on their side so they may not feel so obligated to signal that fifth hike of the cycle, though the mere threat of a hike still allows them to manage inflation expectations.
Household spending is the warm-up act for Tuesday’s RBA meeting. But a hot spending report coupled with higher inflation figures could rekindle expectations of another hike.
This content was created by an affiliate of FOREX.com and represents the views and opinions of the author/speakers, not the views and opinions of FOREX.com, StoneX Group Inc., or its subsidiaries. The content has not been independently reviewed by FOREX.com.
US Data and Fed Speakers Shape Rate Expectations
As for US data, PCE inflation, nonfarm payrolls and ISM manufacturing are at the top of the list – though we also have ADP employment, JOLTS job openings and Challenger job cuts. There are also plenty of Fed speakers this week, and while only two of them are current FOMC voters, their collective opinions can sway market pricing. That places Williams and Kashkari at the top of the list, although incoming data will ultimately have greater influence over expectations for next year and whether the Fed’s next hike comes in November or December.
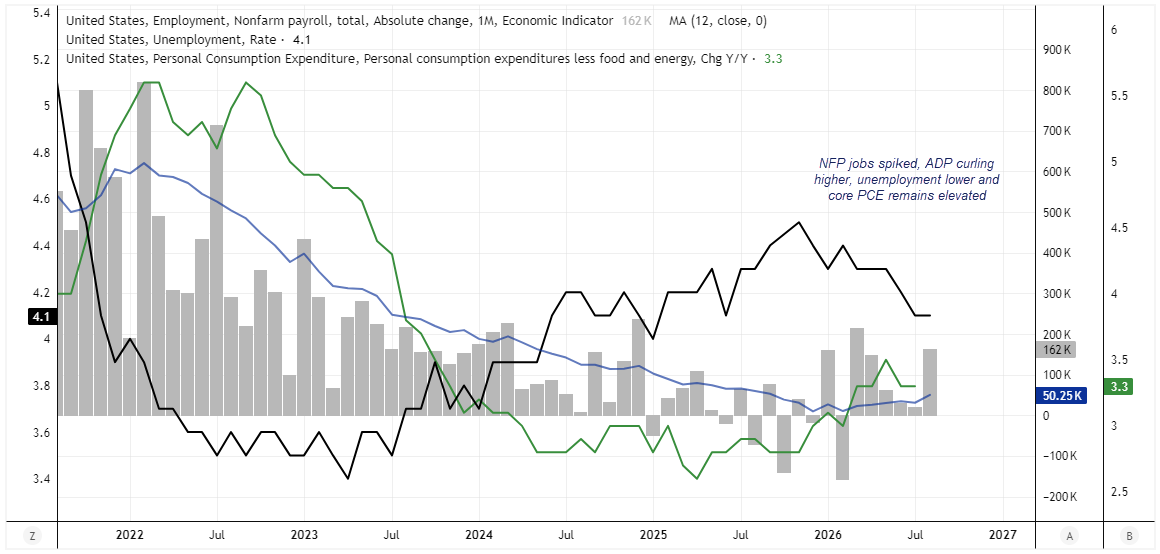
Source: BLS, ADP, LSEG
AUD/USD Technical Analysis: Australian Dollar vs US Dollar
AUD/USD Correlations
- The US dollar remains the dominant driver: AUD/USD has a -0.95 correlation with DXY over both 10 and 20 days, so further dollar strength remains the clearest external headwind for the Aussie.
- China-sensitive markets are still providing useful confirmation: AUD/USD’s 10-day correlation is +0.97 with CNH/USD, +0.93 with iron ore and +0.83 with the CSI 300. A stronger yuan/China complex would therefore support any AUD/USD rebound.
- Broad commodities are strongly aligned with AUD/USD: CRB, gold and iron ore all show strong positive 10-day correlations. But copper and WTI have broken away sharply over five days, so they are currently less reliable signals.
- Equity signals are mixed: the ASX and CSI 300 remain positively correlated with AUD/USD, while the S&P 500 relationship is weak-to-negative. For now, DXY and China-related markets look more useful than generic “risk-on/risk-off” signals.
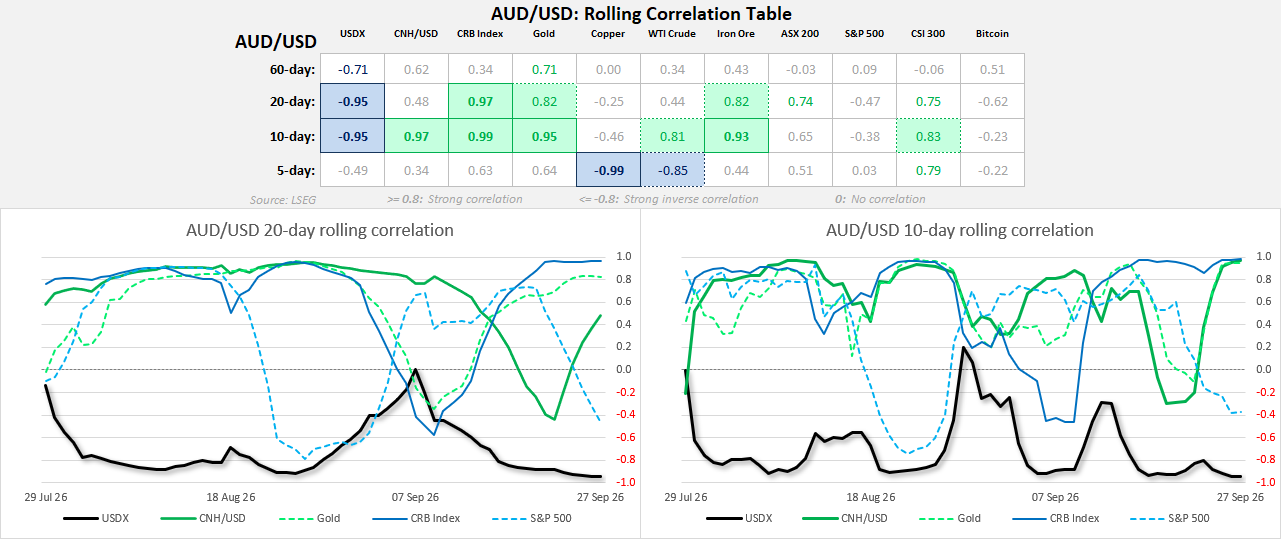
Source: LSEG
AUD/USD Futures Positioning | COT Report
Price action is finally reflecting what futures positioning has been showing for several months – a bearish outlook for AUD/USD. It seems Aussie bears were right to hold on with conviction overall, despite its 10-week rally before momentum turned. Gross-shorts remained near their record levels among large speculators and asset managers, though the standout stat is seeing total open interest plunge at its fastest week on record. This measures all futures activity – not just speculative – suggesting there has been a strong capitulation amid the increasingly bearish selloff.
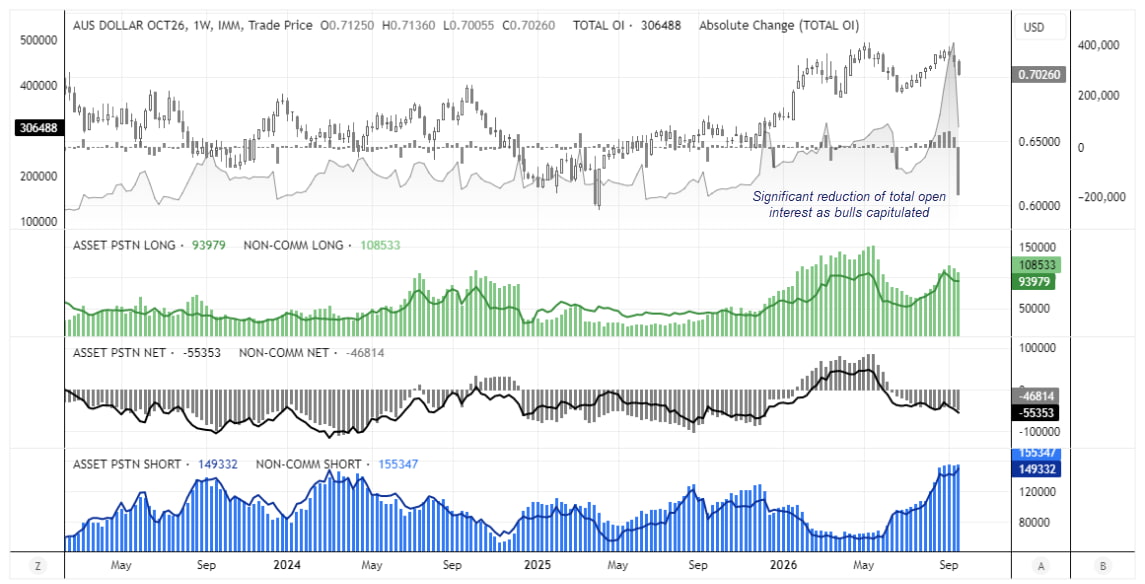
Source: CFTC (COT) CME, LSEG
For traders wanting a deeper understanding of futures positioning, I’ve also published a guide on how to read and interpret weekly COT data in forex markets.
For traders wanting a deeper understanding of futures positioning, I’ve also published a guide on how to read and interpret weekly COT data in forex markets.
AUD/USD Options, Yield Spreads and US Dollar Strength
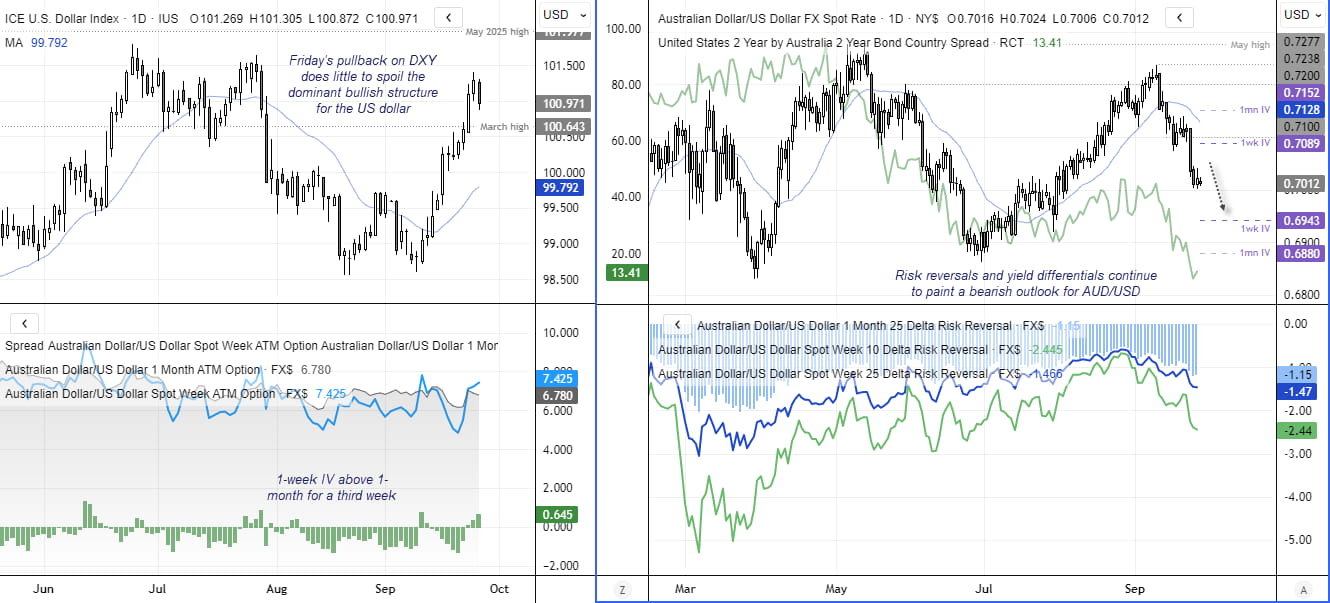
We really need to begin the analysis for the Australian dollar via the US dollar, given its apparent strength. While prices pulled back on Friday, it does little to undermine the rally that took DXY above 100 with little resistance. And with 1-week implied volatility for AUD/USD above the 1-month for a third week and the spread rising, it suggests options traders are anticipating more turbulence.
AUD/USD fell for a third week as bearish momentum increased. Risk reversals show that options traders continued to increase their demand for puts relative to calls, with the 10-delta – a proxy for tail risk – reaching a 10-week low.
And with the AU-US 2-year yield spread falling to its lowest level since November, it continues to hint at further downside for AUD/USD. The spread peaked back in April and has proven to be a decent lead for the Aussie by several weeks since.
Even if the RBA hike manages to prompt a bounce, all other clues point towards a ‘fade the rally’ scenario for AUD/USD for now, which seems like it wants to eventually break below 70c.
Source: ICE, TradingView
Australian Dollar Performance
Source: LSEG


Open an account in minutes
Experience award-winning platforms with fast and secure execution, and enjoy tight spreads from 0.5 pts on FX and 0.3 pts on indices.
Economic calendar
Web Trader platform
Our sophisticated web-based platform is packed with features.
Related articles
USD/JPY weekly outlook: Quarter turn scrambles rates regime
USD/JPY’s tight relationship with front-end US rates broke down sharply last week, but quarter-turn flows and positioning suggest the disconnect may prove temporary.

USD/CAD forecast: rally could accelerate above June highs at 1.4250
USD/CAD recovered quickly after weaker US jobs data, keeping the bullish trend in focus. A move above the June highs could accelerate the rally as inflation keeps the Fed under pressure.


USD Sets Fresh Yearly High as EUR/USD Drops Dramatically, USD/JPY Stable
Well, it was a week of USD strength that wasn’t entirely pushed by USD/JPY, as a strong sell-off in EUR/USD has pushed the major pair to its most oversold state in a decade.

This report is intended for general circulation only. It should not be construed as a recommendation, or an offer (or solicitation of an offer) to buy or sell any financial products. The information provided does not take into account your specific investment objectives, financial situation or particular needs. Before you act on any recommendation that may be contained in this report, independent advice ought to be sought from a financial adviser regarding the suitability of the investment product, taking into account your specific investment objectives, financial situation or particular needs.
StoneX Financial Pte. Ltd., may distribute reports produced by its respective foreign entities or affiliates within the StoneX group of companies or third parties pursuant to an arrangement under Regulation 32C of the Financial Advisers Regulations. Where the report is distributed to a person in Singapore who is not an accredited investor, expert investor or an institutional investor (as defined in the Securities Futures Act), StoneX Financial Pte. Ltd. accepts legal responsibility to such persons for the contents of the report only to the extent required by law. Singapore recipients should contact StoneX Financial Pte. Ltd. at 6826 9988 for matters arising from, or in connection with the report.
In the case of all other recipients of this report, to the extent permitted by applicable laws and regulations neither StoneX Financial Pte. Ltd. nor its associated companies will be responsible or liable for any loss or damage incurred arising out of, or in connection with, any use of the information contained in this report and all such liability is hereby expressly disclaimed. No representation or warranty is made, express or implied, that the content of this report is complete or accurate.
StoneX Financial Pte. Ltd. is not under any obligation to update this report.
Trading CFDs carries a high level of risk that may not be suitable for some investors. Consider your investment objectives, level of experience, financial resources, risk appetite and other relevant circumstances carefully. The possibility exists that you could lose some or all of your investments, including your initial deposits. If in doubt, please seek independent expert advice. Visit www.forex.com/en-sg/terms-and-policies for the complete Risk Disclosure Statement.