



USDJPY, USDCAD Outlook: Key Levels in Focus
USDJPY, USDCAD Outlook: with Chinese reports pointing to diversification away from U.S. Treasuries, JOLTS job openings dropping to 2020 lows, and rising uncertainty ahead of the upcoming NFP and CPI reports, dollar pairs are facing pressure near defining levels.
Share this:

Key Events
• China’s reported move to diversify away from U.S. Treasuries pulled dollar pairs back toward defining support levels
• The sharp drop in last week’s JOLTS job openings report is limiting risk appetite ahead of the NFP report on Wednesday and the CPI report on Friday
• Fundamental pressures are redirecting the DXY, USDCAD, and USDJPY toward critical support and defining levels
The DXY’s Weekly Wick vs its 18-Year Support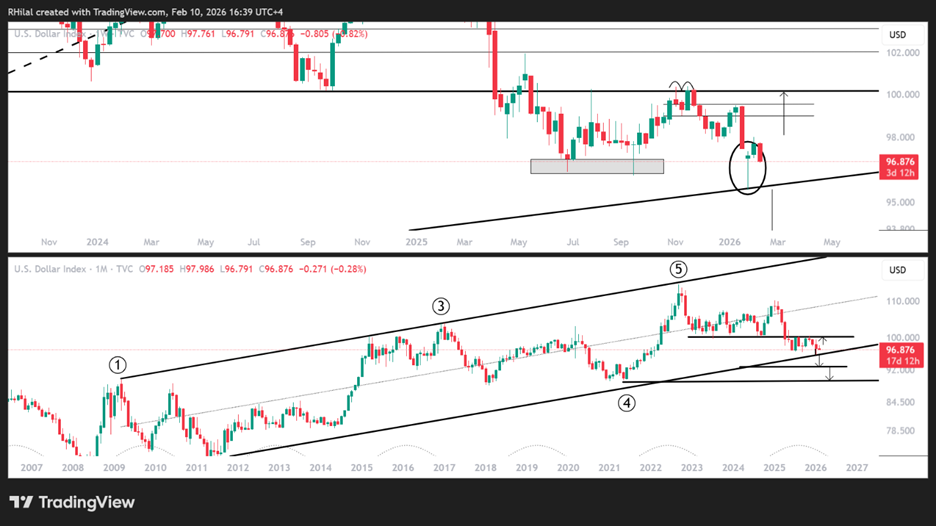
Source: Trading view
The DXY’s weekly wick highlights the inability of bears to sustain losses near the 95–96 zone, a key area expected to define either the continuation of the longstanding bullish trend or a potential bearish structural shift. A bearish weekly session followed that bounce, mirroring price behavior seen on the USDJPY and USDCAD charts. This comes amid growing caution ahead of the upcoming NFP report, following last week’s drop in JOLTS job openings to 6.54M, levels last seen in 2020.

NFP expectations currently stand near 70k job additions, following the delay caused by the U.S. government shutdown. Chinese reports added to this bearish bias, with moves toward diversifying away from U.S. Treasuries and hedging against shifting policy risks, keeping key support zones in focus to confirm either a structural breakdown or another rebound from these levels.
The key level on the DXY remains the 95–96 zone. For USDJPY and USDCAD, the analysis follows below.
Technical Analysis: Quantifying Uncertainty
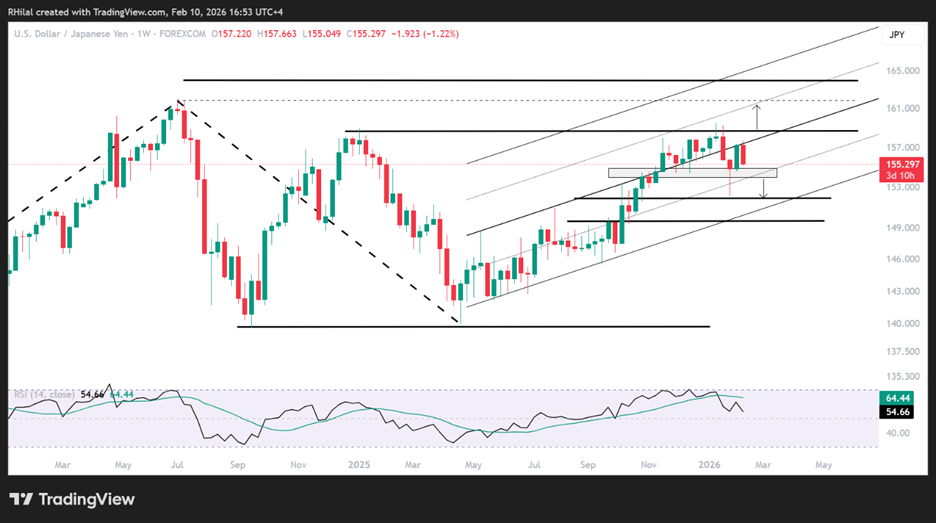
USDJPY Outlook – Weekly Time Frame – Log Scale
Source: Trading view
Looking at the weekly candles between December 2025 and February 2026, a clear support zone emerges between 154.80 and 153.80. The steep wick observed on the DXY chart is also reflected on USDJPY, yet the weekly close managed to hold above this zone, reinforcing its technical importance.
This leaves the scenarios as follows:
A weekly close below the 154.80–153.80 range would extend bearish bias toward the lower bound of the respected channel in place since the April 2025 lows, with key levels in focus between 151.80 and 149.60. These levels would either preserve the broader bullish structure from April or confirm a deeper bearish shift toward the 140s.
On the upside, the upper boundary of the channel near 157.50 needs to be cleared to realign with 158.80 and 161. These levels may once again raise intervention risks or open the path toward an extended rally.
In terms of the USDCAD
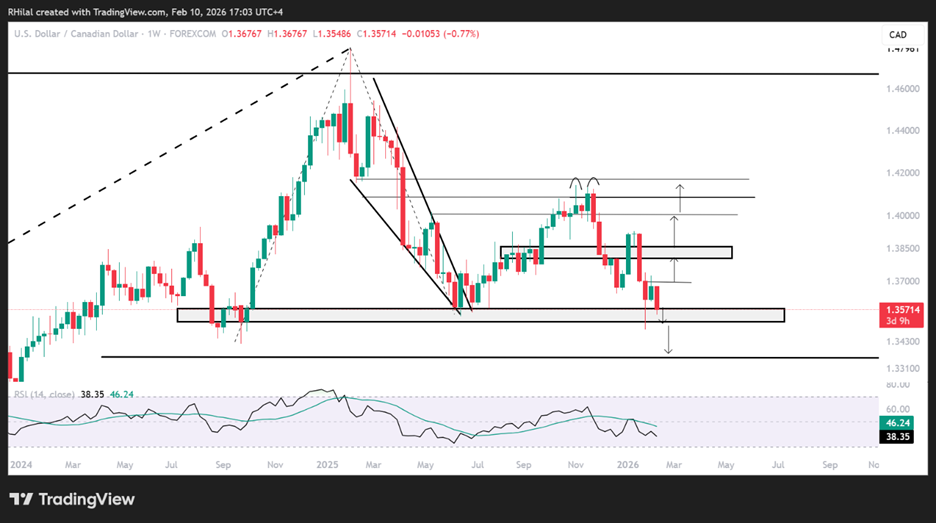
USDCAD Outlook – Weekly Time Frame – Log Scale
Source: Trading view
Price action on the USDCAD chart is once again challenging the support zone that has held since August 2024 near the 1.35 level. A weekly close below 1.35 would expose the pair to a steeper decline toward 1.33 and 1.3150, levels last seen in 2023. Such a move would likely align with a DXY breakdown and renewed strength across major currency pairs toward 2022 extremes.
On the upside, should USDCAD recover above the open of the weekly candle that formed the steep wick into the 1.35 zone, at 1.3640 and 1.37, bullish bias would likely re-emerge. This would reopen the path toward 1.3880 and 1.40, testing the sustainability of a broader bullish continuation scenario.
Written by Razan Hilal, CMT
Follow on X: @Rh_waves
Related tags:
Latest market news



Open an account in minutes
Experience award-winning platforms with fast and secure execution, and enjoy tight spreads from 0.5 pts on FX and 0.3 pts on indices.
Economic calendar
Web Trader platform
Our sophisticated web-based platform is packed with features.
Related articles
S&P 500, Nasdaq, Dow Forecast: Wall Street Split Widens Into Month-End 9 26 2026
Nasdaq strength contrasts with mounting Dow pressure as rising Treasury yields raise the stakes for stocks heading into the monthly close.
EUR/USD weekly outlook: Oil, inflation and NFP in focus
After coming under significant pressure in recent weeks, the EUR/USD came off its lows to finish the week on a positive note on Friday, albeit with only a mild rebound. That was not enough to prevent the exchange rate falling for the third consecutive week, as the US dollar and bond yields rallied across the board.


EUR/USD Q4 2026 Outlook: Euro at a Crossroads as Fed, ECB Tighten 9 25 2026
EUR/USD enters Q4 at a pivotal inflection point as competing Fed-ECB policy paths and persistent inflation risks collide with major technical support.
This report is intended for general circulation only. It should not be construed as a recommendation, or an offer (or solicitation of an offer) to buy or sell any financial products. The information provided does not take into account your specific investment objectives, financial situation or particular needs. Before you act on any recommendation that may be contained in this report, independent advice ought to be sought from a financial adviser regarding the suitability of the investment product, taking into account your specific investment objectives, financial situation or particular needs.
StoneX Financial Pte. Ltd., may distribute reports produced by its respective foreign entities or affiliates within the StoneX group of companies or third parties pursuant to an arrangement under Regulation 32C of the Financial Advisers Regulations. Where the report is distributed to a person in Singapore who is not an accredited investor, expert investor or an institutional investor (as defined in the Securities Futures Act), StoneX Financial Pte. Ltd. accepts legal responsibility to such persons for the contents of the report only to the extent required by law. Singapore recipients should contact StoneX Financial Pte. Ltd. at 6826 9988 for matters arising from, or in connection with the report.
In the case of all other recipients of this report, to the extent permitted by applicable laws and regulations neither StoneX Financial Pte. Ltd. nor its associated companies will be responsible or liable for any loss or damage incurred arising out of, or in connection with, any use of the information contained in this report and all such liability is hereby expressly disclaimed. No representation or warranty is made, express or implied, that the content of this report is complete or accurate.
StoneX Financial Pte. Ltd. is not under any obligation to update this report.
Trading CFDs carries a high level of risk that may not be suitable for some investors. Consider your investment objectives, level of experience, financial resources, risk appetite and other relevant circumstances carefully. The possibility exists that you could lose some or all of your investments, including your initial deposits. If in doubt, please seek independent expert advice. Visit www.forex.com/en-sg/terms-and-policies for the complete Risk Disclosure Statement.