



Weekly Equities Outlook: Meta, Apple & Amazon
After Alphabet’s jump in capex sent the share price sharply lower, the market is nervously eyeing earnings from Meta and Amazon. Apple earnings are also in focus as the share price of the most valuable company trades near its record high.
Share this:

Meta Q2 earnings preview
- Meta is set to report Q2 earnings on July 29 after the market closes.
- EPS is expected at $7.18 on revenue of $60.2 billion, representing growth of 26% year over year.
Expectations are for another strong quarter of advertising growth, supported by AI-driven improvements in ad targeting and user engagement.
After Alphabet shares fell 7% despite reporting strong revenue growth after raising capital expenditure guidance, investors will be watching to see whether Meta is also increasing AI infrastructure spending faster than revenue growth.
With investors showing signs of losing patience, the key question is whether Mark Zuckerberg can convince the market that massive AI investments will translate into higher future earnings rather than simply higher costs.
Meta could raise its capital expenditure outlook to between $135 billion and $150 billion from the current range of $125 billion to $145 billion, reflecting higher AI infrastructure and memory costs.
Advertising remains Meta's core earnings driver. Markets will be looking for continued growth in ad impressions, stable or rising average revenue per ad, and evidence that AI recommendations are improving engagement and monetisation.
User metrics, including daily active users and engagement across Instagram, Facebook, WhatsApp and Threads, remain important, although they have become less of a share price driver than AI spending and monetization.
Guidance will also be closely watched, particularly Meta's Q3 revenue outlook and commentary on AI infrastructure spending. Evidence that AI investment is improving ad targeting, engagement and monetisation would support the bullish case. Conversely, higher spending without a clear improvement in profitability could trigger a reaction similar to Alphabet's.
How to trade Meta earnings
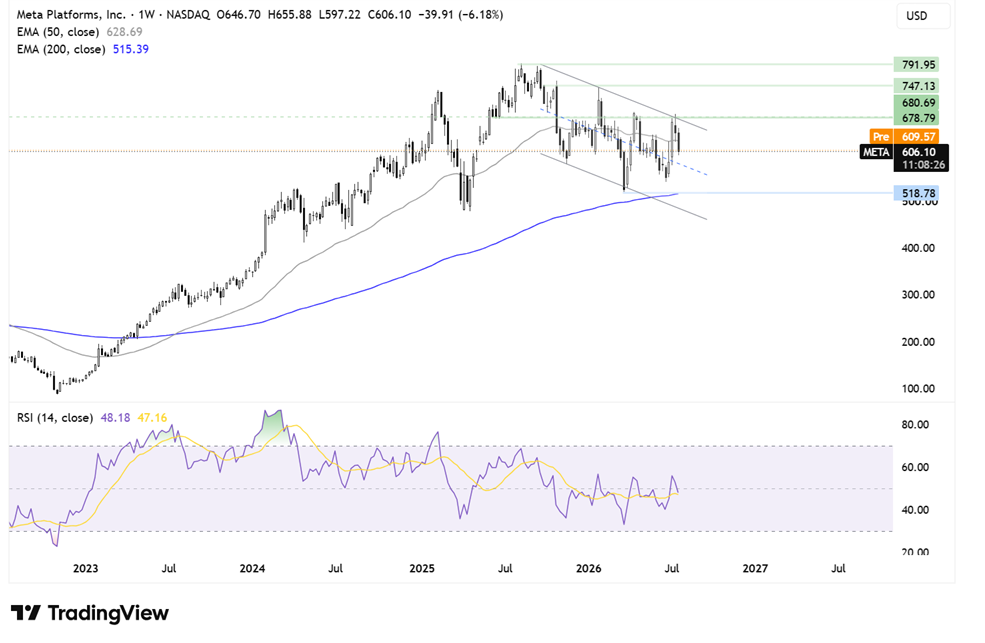
On the weekly chart, Meta ran into resistance at the record high of 793 in August 2025 and has been trading in a downward-trending channel since then. The price is falling below the 50 EMA but continues to trade above the 200 EMA at 514.
A break below this level would strengthen the bearish trend.
Buyers would need to rise above 676 to take out the upper band of the falling trend line and the July high to create a higher high and bring resistance that's 750 into focus ahead of 793 in fresh record highs.
Apple Q3 earnings preview
- Apple will report fiscal Q3 earnings on Thursday, July 30, after the market closes.
- Expectations are for EPS of $1.89 on revenue of $108.8 billion, reflecting solid double-digit growth from the same period last year.
Apple heads into earnings with a high bar after March-quarter revenue rose 17% to $111.2 billion while EPS increased 22% to $2.01. As a result, even a modest beat may not materially change the investment outlook.
iPhone demand
The iPhone remains the company's most important product. During the March quarter, iPhone revenue climbed 22% to $57 billion, helped by stronger demand for Pro models. Apple also reported a record number of upgrades and an active installed base exceeding 2.5 billion devices.
Deferred demand from earlier supply constraints could provide some support to fiscal Q3 iPhone sales, although rising component costs remain a risk. Investors will also be watching whether Apple has sufficient pricing power to offset those higher costs.
China
China remains another major focus. Revenue in Greater China rose 28% to $20.5 billion in the March quarter, while IDC estimates Apple's smartphone shipments increased 24.4% during the June quarter despite the overall Chinese smartphone market contracting by 4.3%. These figures are encouraging, although competition from Huawei, Xiaomi and other domestic manufacturers remains intense.
Services revenue rose 16% to $31 billion in the March quarter, with gross margins of 76.7% compared with 38.7% for products. These figures highlight the importance of the Services business to Apple's overall profitability.
Services
Apple has indicated that Q3 Services growth should remain broadly similar after adjusting for foreign exchange. Investors will be looking for continued momentum across the App Store, advertising, subscriptions, cloud services and payments, alongside further growth in paid subscriptions and transaction accounts.
Apple's research and development spending rose 34% to $11.4 billion in the March quarter as it continues developing its own AI models while working with Google under a multi-year Gemini partnership.
Earlier this year, investors wanted reassurance that Apple had a credible AI strategy. The focus has now shifted towards whether AI can accelerate iPhone upgrade cycles and deepen user engagement rather than simply becoming another source of rising costs.
How to trade Apple earnings
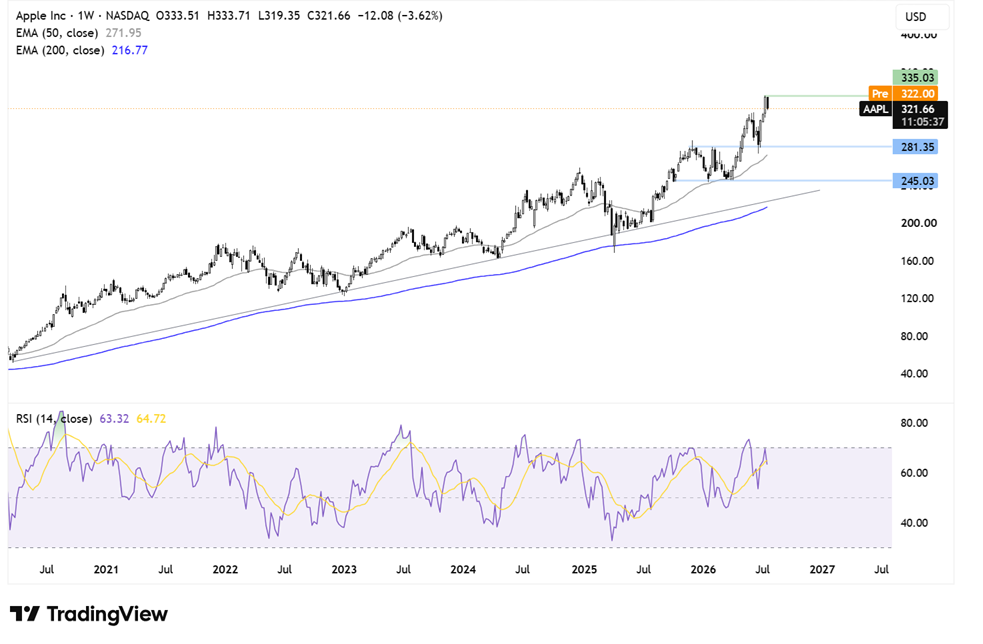
Apple has remained in a long-term uptrend, continuing to trade above both its rising trend line and its 50 and 200-day moving averages before meeting resistance at the record high of 333 this week.
A break above this level could open the door towards 350 before bringing 400 into focus as the next longer-term upside target.
Immediate support can be seen around 280. A break below this level would create a lower low and expose the 2026 low near 250.
Amazon Q2 earnings preview
- Amazon will report Q2 earnings on July 30 after the market closes.
- Expectations are for EPS of $1.82 on revenue of approximately $100 billion.
Amazon Web Services will remain the key focus after delivering 28% revenue growth in Q1, its fastest pace in almost four years. Investors will be keen to see whether AWS continues keeping pace with Microsoft Azure and Google Cloud in the AI race.
However, following Alphabet's sharp sell-off after raising capital expenditure guidance, the key risk heading into earnings is whether Amazon also lifts its AI infrastructure spending outlook.
Amazon has already guided for around $200 billion of capital expenditure in 2026, and investors will be watching closely to see whether that figure increases further.
Beyond cloud revenue, investors will also assess whether heavy AI infrastructure investment is beginning to squeeze AWS operating margins.
North American retail will also be closely watched, with e-commerce sales growth, Prime Day performance and retail operating margins all in focus. A resilient consumer business could help offset concerns surrounding AI investment.
Advertising has become one of Amazon's fastest-growing and highest-margin businesses. Continued double-digit growth would provide another positive catalyst for the shares.
How to trade Amazon earnings
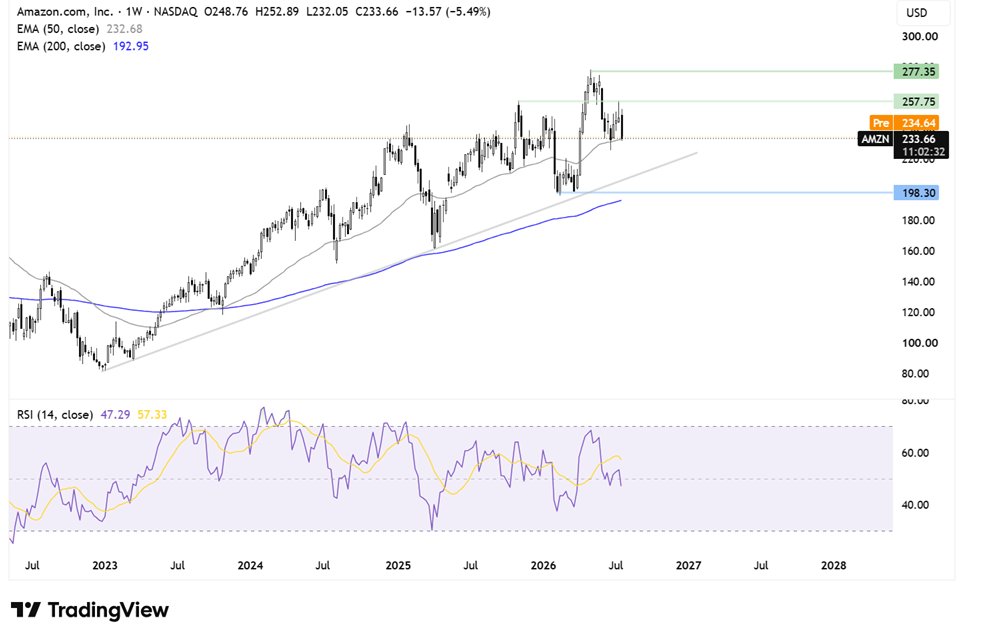
Amazon has remained in a strong uptrend since 2023, forming a series of higher highs and higher lows before meeting resistance at the record high of 278. The share price has since eased back and is currently testing support at the 50 EMA around 233.
A break below the 50 EMA would expose support at 208, where the rising trend line sits, ahead of the psychological 200 level. A move below there would strengthen the bearish outlook.
Should the 50 EMA continue to hold, the broader uptrend remains intact, with buyers looking towards 258 before a move back to the record high at 278.
Related tags:
Latest market news



Open an account in minutes
Experience award-winning platforms with fast and secure execution, and enjoy tight spreads from 0.5 pts on FX and 0.3 pts on indices.
Economic calendar
Web Trader platform
Our sophisticated web-based platform is packed with features.
Related articles
S&P 500, Nasdaq, Dow Forecast: Wall Street Split Widens Into Month-End 9 26 2026
Nasdaq strength contrasts with mounting Dow pressure as rising Treasury yields raise the stakes for stocks heading into the monthly close.
Weekly Equities Outlook: Nike, Micron Technology, Carnival Corp.
Earnings from Nike comes as the share price trades at a 12-year low. Micron Technology keeps the AI trade in focus and Carnival suffers from rising fuel costs.

Weekly Equities Forecast: Costco, JD Sports & Strategy
Earnings Costco, JD Sports report earnings and crypto stocks are in focus with after Friday's SEC announcement which boosted BTC.
This report is intended for general circulation only. It should not be construed as a recommendation, or an offer (or solicitation of an offer) to buy or sell any financial products. The information provided does not take into account your specific investment objectives, financial situation or particular needs. Before you act on any recommendation that may be contained in this report, independent advice ought to be sought from a financial adviser regarding the suitability of the investment product, taking into account your specific investment objectives, financial situation or particular needs.
StoneX Financial Pte. Ltd., may distribute reports produced by its respective foreign entities or affiliates within the StoneX group of companies or third parties pursuant to an arrangement under Regulation 32C of the Financial Advisers Regulations. Where the report is distributed to a person in Singapore who is not an accredited investor, expert investor or an institutional investor (as defined in the Securities Futures Act), StoneX Financial Pte. Ltd. accepts legal responsibility to such persons for the contents of the report only to the extent required by law. Singapore recipients should contact StoneX Financial Pte. Ltd. at 6826 9988 for matters arising from, or in connection with the report.
In the case of all other recipients of this report, to the extent permitted by applicable laws and regulations neither StoneX Financial Pte. Ltd. nor its associated companies will be responsible or liable for any loss or damage incurred arising out of, or in connection with, any use of the information contained in this report and all such liability is hereby expressly disclaimed. No representation or warranty is made, express or implied, that the content of this report is complete or accurate.
StoneX Financial Pte. Ltd. is not under any obligation to update this report.
Trading CFDs carries a high level of risk that may not be suitable for some investors. Consider your investment objectives, level of experience, financial resources, risk appetite and other relevant circumstances carefully. The possibility exists that you could lose some or all of your investments, including your initial deposits. If in doubt, please seek independent expert advice. Visit www.forex.com/en-sg/terms-and-policies for the complete Risk Disclosure Statement.