

Pivot points are one of the most popular technical tools among traders. Learn how they work here, including how to calculate pivot points and an example pivot point trading strategy.
- Pivot point meaning
- How do pivot points work?
- How to calculate pivot points
- How to trade with pivot points
- Pivot point trading strategy
- Are pivot points reliable?
- Pivot points vs Fibonacci retracements
Pivot point meaning
In technical analysis, a pivot point means an area at which a market’s price is more likely to reverse. They’re plotted on technical charts using the previous session’s price data and are used to predict where future support and resistance levels might lie.
Pivot points are most popular among day traders, who aim to never keep any positions open overnight. This short-term trading style requires holding positions open for short periods, so knowing when markets might reverse over the course of the day is crucial.
Learn more about how to read charts.
How do pivot points work?
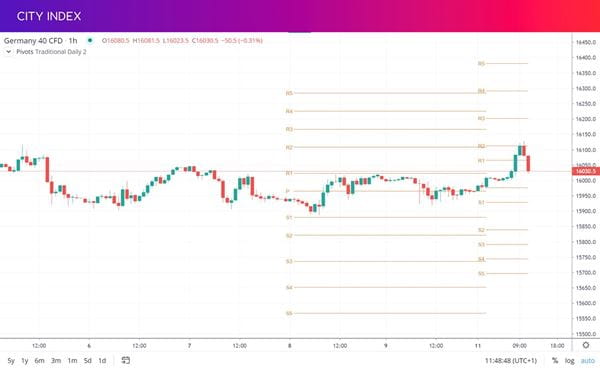
Pivot points work by performing calculations on the last session’s price action: usually the previous day, although you can use pivot points over hours, weeks or months too. These calculations generate a P line plus potential new support and resistance levels, which are then plotted onto a chart.
If a market is trading above the P line, it is generally taken as a bullish signal. If it is below P, it is generally considered bearish.
The support and resistance levels, meanwhile, can inform your trading over the course of the day. Then, at the beginning of the next session, you can calculate a new set based on the previous price action.
How to calculate pivot points
To calculate pivot points, you perform a series of mathematical functions on the previous session’s price data. Each function will give you a new pivot point level, with some calculating support areas and others resistance.
When you’re trading, you won’t have to perform any of these calculations yourself – the pivot points indicator does it for you automatically. But understanding the maths behind the indicator can help you decide whether pivot point trading is for you.
Pivot points formula
There are a series of pivot point formulas, each giving a different line. The first gives the line P, which is the basis of the rest of the calculations. The formula for P is:
P = (High + Low + Close) / 3
So P is an average of the market’s previous high, low and closing prices. If the FTSE 100 hits a high of 7100, a low of 7,050 and closed at 7,120, P would be (7100 + 7050 + 7120 = 21,270 / 3) 7090.
From here, you can calculate the support and resistance levels, generally labelled S1, S2, R1 and R2. Here are the formulas for each:
S1 = (P x 2) – High
S2 = P – (High – Low)
R1 = (P x 2) – Low
R2 = P + (High – Low)
To see how this works in action, we can plug in the figures from our FTSE example above:
S1 = (7090 x 2) – 7100 = 7080
S2 = 7090 – (7100 – 7050) = 7040
R1 = (7090 x 2) – 7050 = 7130
R2 = 7090 + (7100 – 7050) = 7140
How to trade using pivot points
The most common method of trading using pivot points is to use the P line to gauge the market’s current trend and momentum. If an asset’s price is above P, then it is a sign that bulls have control, if it is below P then bears are in charge.
Sometimes, you might see a market hovering around the P line but struggling to break through it. This can mean indecision among buyers and sellers, with a possible trend in either direction once one side wins out.
Support and resistance with pivot points
Once a trend takes hold, traders will use the S1, S2, R1 and R2 lines as potential areas of support and resistance. Range traders, for example, might buy a market once it drops to S1, then sell it once it rises to R1. Or you might look for breakouts through any of the support or resistance lines as signals of new forming trends.
As with any technical tool, pivot points are best used in conjunction with other indicators and signals. You’ll want to check that the P, S & R lines correlate to previous known levels of support and resistance, or check for a reversal pattern for a stronger signal that sentiment may switch.
Example pivot point trading strategy
Let’s look at an example range trading strategy using pivot points on EUR/GBP.
First of all, you’d use the pivot points indicator to calculate the P, S and R lines on your chart. Then you can check with EUR/GBP is above or below P. Which should give an indication of the market’s current sentiment.
At this point, it’s also worth checking whether any of the lines correlate with previous key levels of support or resistance. This makes it more likely that Chunnel will reverse there – meaning an opportunity for our range trading strategy.
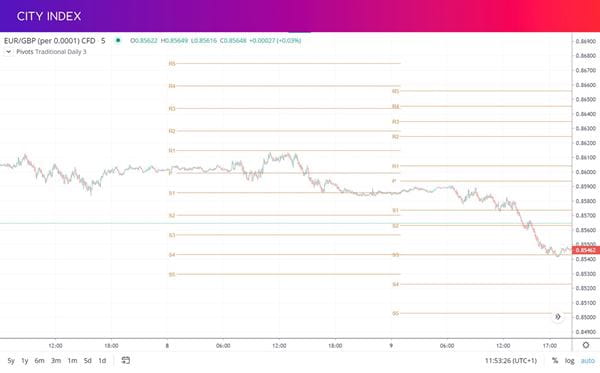
After hovering around P, EUR/GBP rallies towards R1, which lines up with a previous level of resistance. The signal becomes stronger as the market tests R1 multiple times, but never breaks out. At this point, we might consider opening a short position with a stop between R1 and R2 and a profit target at either P or S1.
As you can see, the trade would’ve been profitable, enabling us to capture 28 pts of profit.
Start trading with pivot points
Then to start trading pivot points with City Index, follow these steps:
- Open your City Index trading account
- Log in to our award-winning online trading platform, download our mobile trading apps or access third-party tools including MT4 and TradingView
- Select pivot points from the list of indicators on any of our charts
- Open your position
Or you can test out your pivot point trading strategy with a free demo account. This gives you virtual funds to try out trading our full range of markets, with access to all our indicators and tools.
Pivot point calculator
As well as plotting pivot points on a chart, you can quickly see the levels for any given market by checking its pivot point calculator. On the City Index site, you can see the pivot point calculator for any market below its chart. See the points for the Dow Jones (Wall Street), EUR/USD and gold – or search for your chosen market in the bar above.
Are pivot points reliable?
Pivot points are a popular indicator, so lots of traders will be looking at the exact same levels on their chart as you. This can make them self-fulfilling, increasing their reliability – especially on highly liquid markets.
However, they only provide rough areas at which a market will reverse. As we’ve covered above, they’re stronger when combined with additional technical analysis. Confirming that the S & R levels align with previous support or resistance, or waiting for a market to repeatedly test a line will both give a better signal.
Pivot points vs Fibonacci retracements
Pivot points are similar to Fibonacci retracements, and both indicators use previous price action to calculate predicted reversal areas on a chart. However, they work in different ways.
The Fibonacci retracement tool plots known Fibonacci ratio levels on a chart based on a previous significant move. So, if the FTSE 100 performs a major rally then reverses, you can use Fibonacci retracements to plot where the reversal might end based on Fibonacci theory.
As we’ve seen, pivot points perform calculations based on the previous session’s price data. So they don’t need a significant move to work, and they don’t use Fibonacci analysis.
Some traders combine pivot points and Fibonacci retracements – after all, if a pivot line falls at the same level as a Fib, you have a much stronger signal of a reversal.
Latest market news
April 25, 2024 03:09 PM
April 25, 2024 03:00 PM
April 25, 2024 01:12 PM
Latest Financial market insight articles

March 26, 2024 04:11 AM
November 16, 2023 10:23 AM

November 13, 2023 11:05 AM

October 25, 2023 01:45 PM