Beyond Meat upside target reached with exhaustion signals
Beyond Meat (BYND)
click to enlarge chart
Key elements
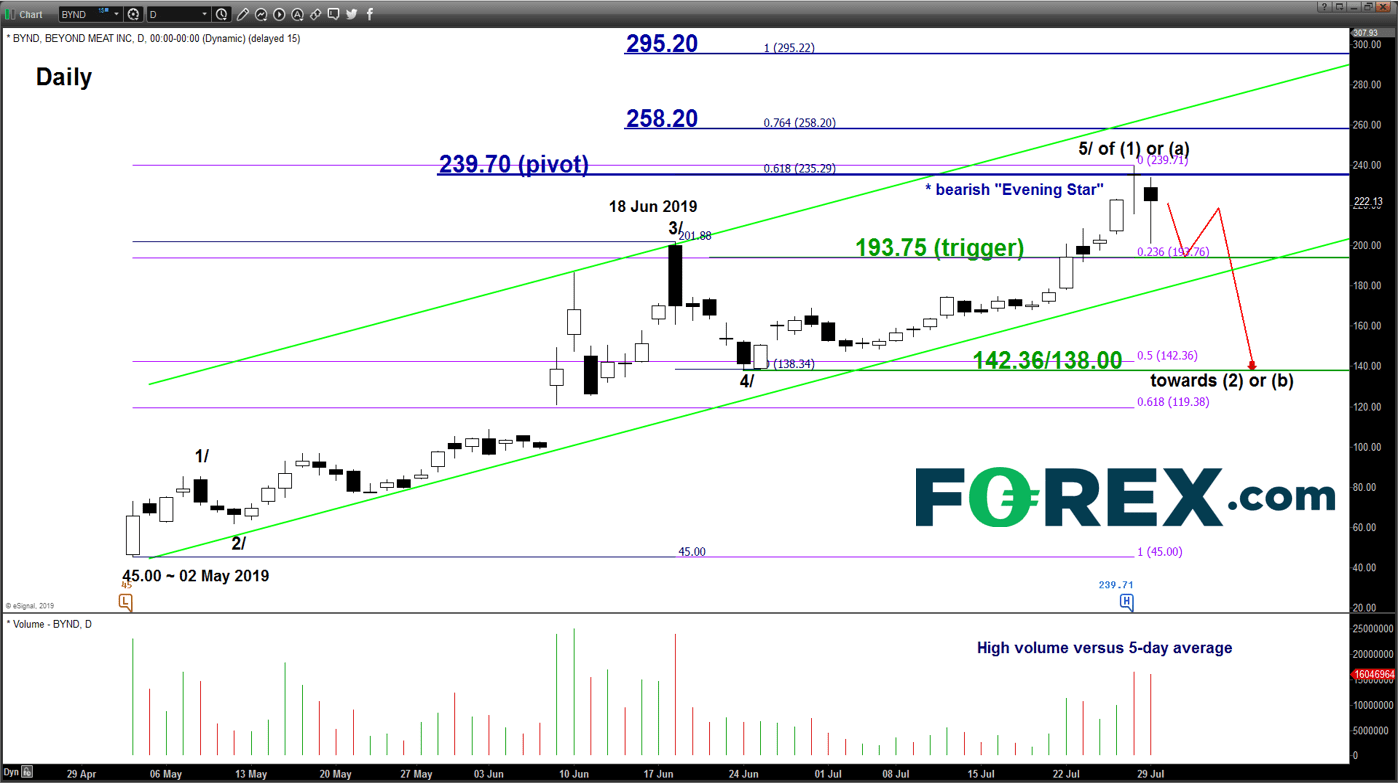
- Since our last report dated on 12 Jul, Beyond Meat (BYND) has rallied as expected and met the medium-term upside target/resistance of 258.20 as per highlighted (click here for a recap).
- It printed an intraday high of 239.71 on last Fri, 26 Jul. Thereafter, it has declined by 16% to print a low of 201.00 at the close of yesterday, 29 Jul U.S. session. After the close, BYND has reported better than expected revenue and reinforced its full-year outlook. However, it missed earnings consensus (-$0.24 EPS versus -$0.08 EPS). Also, it has announced a secondary stock offering just three months after is IPO. The share price of BYND continued to tumble by close to 12% in the after-hours session to print a low of 191.00.
- Last three days of price action since 25 Jul, BYND has formed a daily bearish “Evening Star” candlestick pattern right at the 239.70 key medium-term resistance.
- Interestingly, the 239.70 level is predetermined by a Fibonacci expansion level derived from Elliot Wave.
- Last two days of trading has been accompanied by higher volume which tends to be accompanied by a medium-term reversal in price action coupled with the bearish “Evening Star” candlestick pattern.
- Elliot Wave/fractal analysis has suggested that it may have completed the 5th wave impulsive upleg target, labelled as 5/ to complete entire medium-term bullish cycle in place since 02 May 2019 low. Thus, BYND is at risk now of shaping a significant correction of approximately 40% to retrace the prior bullish cycle.
Key Levels (1 to 3 weeks)
Pivot (key resistance): 239.70
Supports: 193.75 (trigger) & 142.36/138.00
Next resistances: 258.20 & 295.20 (Fibonacci expansion levels)
Conclusion
If the 239.70 key pivotal resistance is not surpassed and a break with a 4-hour close below 193.75 (also the ascending channel support) in the U.S. cash trading session is likely to trigger a potential multi-week corrective decline sequence to target the 142.36/138.00 support zone.
However, a clearance with a daily close above 239.70 invalidates the corrective decline scenario for an extension of the impulsive up move towards 258.20 and even 295.20 next.
Chart is from eSignal
The information on this web site is not targeted at the general public of any particular country. It is not intended for distribution to residents in any country where such distribution or use would contravene any local law or regulatory requirement. The information and opinions in this report are for general information use only and are not intended as an offer or solicitation with respect to the purchase or sale of any currency or CFD contract. All opinions and information contained in this report are subject to change without notice. This report has been prepared without regard to the specific investment objectives, financial situation and needs of any particular recipient. Any references to historical price movements or levels is informational based on our analysis and we do not represent or warranty that any such movements or levels are likely to reoccur in the future. While the information contained herein was obtained from sources believed to be reliable, author does not guarantee its accuracy or completeness, nor does author assume any liability for any direct, indirect or consequential loss that may result from the reliance by any person upon any such information or opinions.
Futures, Options on Futures, Foreign Exchange and other leveraged products involves significant risk of loss and is not suitable for all investors. Losses can exceed your deposits. Increasing leverage increases risk. Spot Gold and Silver contracts are not subject to regulation under the U.S. Commodity Exchange Act. Contracts for Difference (CFDs) are not available for US residents. Products and services available depend on your location and the entity holding your account. Before deciding to trade forex, commodity futures, or digital assets, you should carefully consider your financial objectives, level of experience and risk appetite. Any opinions, news, research, analyses, prices or other information contained herein is intended as general information about the subject matter covered and is provided with the understanding that we do not provide any investment, legal, or tax advice. You should consult with appropriate counsel or other advisors on all investment, legal, or tax matters. References to FOREX.com or GAIN Capital refer to StoneX Group Inc. and its subsidiaries. Please read Characteristics and Risks of Standardized Options.
Please note that foreign exchange and other leveraged trading involves significant risk of loss. It is not suitable for all investors and you should make sure you understand the risks involved, seeking independent advice if necessary.
FOREX.com is a trading name of GAIN Global Markets Inc. which is authorized and regulated by the Cayman Islands Monetary Authority under the Securities Investment Business Law of the Cayman Islands (as revised) with License number 25033.
FOREX.com may, from time to time, offer payment processing services with respect to card deposits through StoneX Financial Ltd, Moor House First Floor, 120 London Wall, London, EC2Y 5ET.
GAIN Global Markets Inc. has its principal place of business at 30 Independence Blvd, Suite 300 (3rd floor), Warren, NJ 07059, USA., and is a wholly-owned subsidiary of StoneX Group Inc.
© FOREX.COM 2026