
Headline-driven volatility continues to dominate short-term price swings, but key technical levels remain intact. The $76–74 zone has repeatedly held as support following declines from the $100 level, marking a significant level tied to the previous Middle East escalation in 2025 between the US, Iran, and Israel.
Disruptions around the Strait of Hormuz typically take time to fully unwind across global energy and commodity supply chains, keeping short-term inflation risks and geopolitical premiums elevated.
Frequent shifts in headlines—ranging from the Strait reopening, partial access for commercial shipping, renewed closures, or US naval blockades—should be viewed primarily as short-term volatility drivers, rather than structural trend changes. These developments sit within the broader framework outlined in the Crude Oil Q2 2026 outlook, which defines the bullish, neutral, and bearish zones.
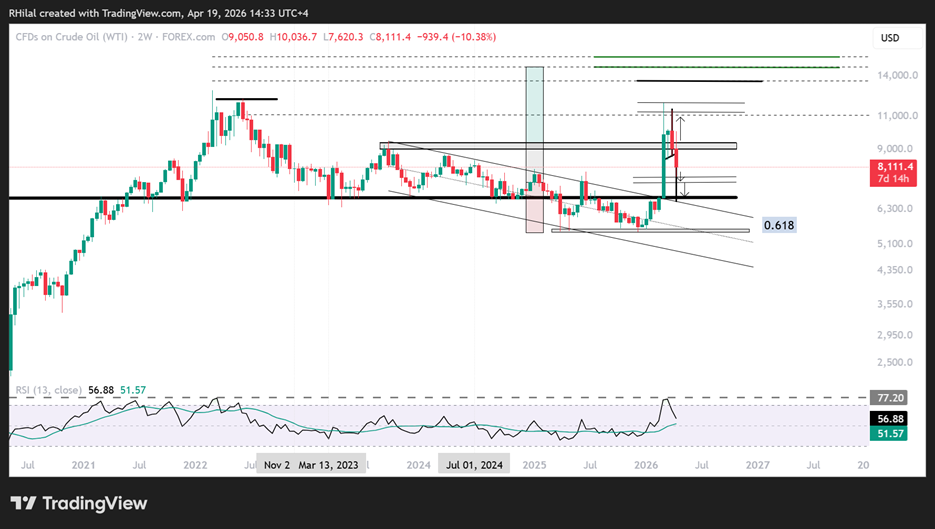
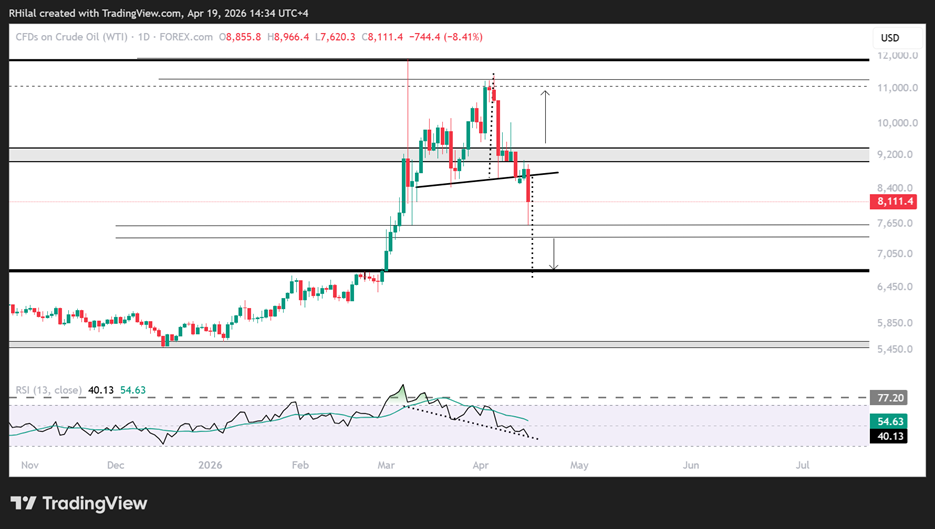
Confirming longer-term reversals requires alignment with shorter timeframes and pattern confirmation, as illustrated in the 2-week and daily WTI charts below.
Crude Oil Weekly Outlook: 2 Week Time Frame – Log Scale
Source: Trading view
The latest decline in crude oil has broken below the previously outlined bullish scenario on the 2-week timeframe, shifting the outlook into a transitional zone between bullish continuation and potential bearish consolidation.
Bearish Scenario
With prices now trading near the lower end of the $80 range, key support levels lie at $76 and $74, aligning with highs from last year’s Middle East conflict. A confirmed breakdown below these levels could expose $67, signaling a broader, longer-term consolidation phase.
Crude Oil Weekly Outlook: Daily Time Frame – Log Scale
Source: Trading view
The recent reversal was further confirmed by a head and shoulders breakout pattern on the daily timeframe, reinforcing the importance of technical analysis in navigating headline-driven markets. A break below the neckline at $84 triggered a sharp decline toward the $76 zone.
The full measured move of this pattern points toward the $67 level, a historically significant support and resistance zone for crude since 2018. This scenario would require a confirmed breakdown below the $76–75 support zone.
On the upside, if crude manages to recover above the $88–93 zone—aligned with 2023 highs—bullish momentum could re-emerge. This would bring the $115 level back into focus, with potential extension toward the $130–150 range.
Conclusion: Focus on Structure, Not Headlines
Despite ongoing geopolitical developments, price action remains the most reliable guide. While Hormuz-related headlines will continue to drive short-term volatility, sustained trends will be confirmed only through key technical levels and pattern validation.
Written by Razan Hilal, CMT
Follow on X: @Rh_waves