
A day after falling more than 2.5%, gold edged higher in early trade on Wednesday, along with global indices and US index futures. The US dollar remained supported, however, although gold or silver showed little concern. The greenback has extended its gains after a hotter-than-expected US CPI report yesterday, which weighed heavily then on gold. That added to the pressure from fading haven demand as hopes of a deal between Washington and Tehran grow. Against that backdrop, I wouldn’t be entirely surprised if gold were to turn lower later on in today’s session or week. With the sellers still defending that $4,106 to $4,140 resistance area, the near-term gold outlook is tilted to the downside – particularly if we now see some follow-up selling that takes us back below the pivotal $3,942 to $4,000.
Hot CPI and a hawkish Waller add to the pressure
The dollar has staged a strong recovery yesterday and has since extended those gains. The greenback has been helped by remarks from Fed Governor Christopher Waller, who suggested that further monetary tightening could be necessary and signalled openness to a larger 50bp move. His comments also weighed on gold and silver – the non-yielding assets that had been leaning largely on haven flows.
The hotter-than-expected October CPI report means rate hikes are not over yet, even if the war ends. Headline prices rose 0.4% month on month against expectations of 0.3%, while core CPI climbed 0.3% versus a outlook of 0.2%. Food prices jumped 0.5%, energy rose 0.7% and gasoline climbed 1.0%, while housing costs increased 0.3%.
The inflation report strengthens the case for further Fed rate hikes, which raises the opportunity cost of holding a non-yielding asset and could further lift front-end Treasury yields when the bond markets re-open tomorrow.
Haven demand fades as US-Iran talks revive
Meanwhile, the oil market has been reducing the risk premium attached to the US-Iran war in recent weeks, although prices have stopped falling in the last couple of days. Qatar has been pushing its diplomatic efforts to broker an end to the war this week. However, the prospects of a breakthrough remain uncertain to say the least. Trump, though, has described his conversation with Qatar's prime minister as excellent and suggested that US military action against Iran now appeared unlikely.
For gold, that matters a great deal. Some of the haven demand that had supported the metal is now coming out of the market, which may explain why gold has struggled to push further after its recent recovery. Lower oil prices and improving risk sentiment this week have also reduced demand for defensive assets more broadly, and gold has not been immune to that shift.
Technical gold outlook and key levels to watch
From a technical analysis point of view, it makes sense for gold to hesitate where it has. The $4,106 to $4,140-ish area was previously both support and resistance, and for now the sellers are holding firm there. Gold would need to break through that zone and hold above it for me to turn bullish. If it fails to do so, the recent break above the short-term bearish trend could turn out to be another trap for the bulls, raising the risk of further liquidation of long positions and a sharp drop.
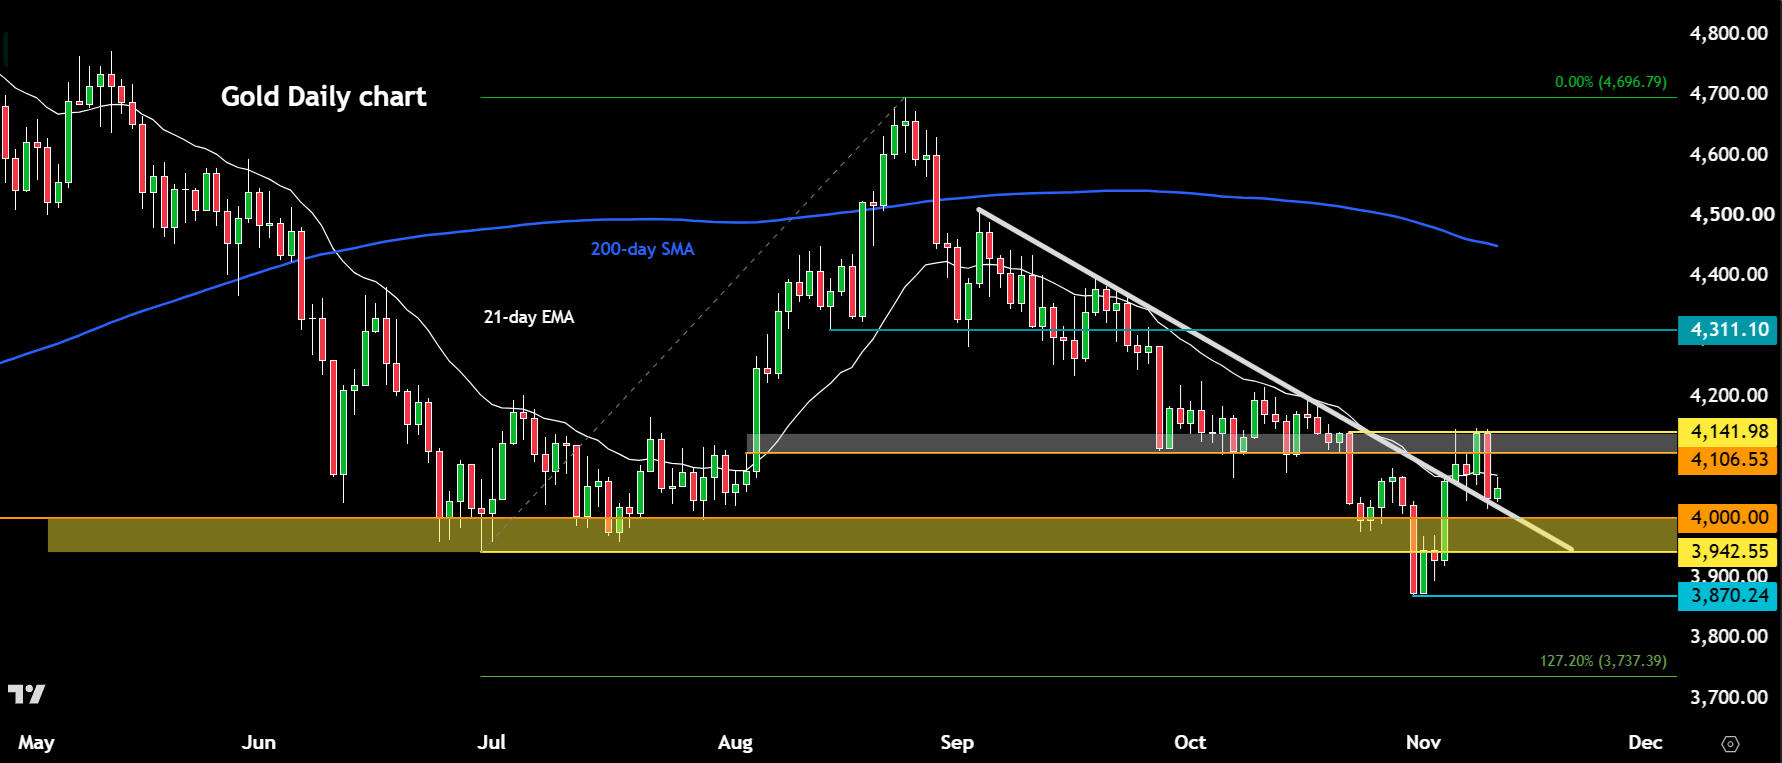
The trigger for that scenario lies lower, in the $3,942 to $4,000 zone of former support and resistance that gold reclaimed last Wednesday. Go back below that area and the short-term bullish price action would be invalidated, with the first target being liquidity resting beneath the most recent low at $3,870. The aforementioned area is a very important technical zone, and how gold behaves around it is worth monitoring closely in the days ahead.
What about the long-term technical gold outlook?
Well, depends how long is long-term in your definition. For me, a good measure is to look at the 200-day moving average, which, as you probably already know, tracks the average closing price over roughly the past 200 trading days. This basically smooths out short-term noise and gives a read on the long-term trend. In an objective way. When price holds above a rising 200-day average, the trend is clearly bullish. When the average flattens and then turns lower, with price trading beneath it, the picture changes.
That is where gold finds itself now. The 200-day moving average sits well above current gold price at approximately $4450 and is starting to point lower, which to me suggests that the long-term trend is bearish, or at least it is no longer as bullish as it once was. It does not mean a collapse is imminent, but it does mean the burden of proof has shifted onto the bulls.
Frequently Asked Questions
Where could gold fall to if support breaks?
Below $3,870, the 127.2% Fibonacci extension of the last major upswing between June and August comes in at $3,738. The 161.8% extension of the same move sits at $3,476, around $24 below the psychologically important $3,500 level, which makes that area a key technical zone.
What would turn the gold outlook bullish again?
A decisive break above the $4,106 to $4,140 resistance area, followed by a hold above it, would make things look bullish once more. In that case, gold could squeeze towards the $4,300 level, or possibly a little higher, before deciding on its next move.
What does the 200-day moving average say about gold?
The long-term 200-day moving average comes in at around $4,450, above the current price, and has started to point lower. That suggests the long-term trend is no longer as bullish as it once was, so any short-term bullish signal, including the recent breakout, should be taken with a pinch of salt.
-- Written by Fawad Razaqzada, Market Analyst | Follow Fawad on Twitter @Trader_F_R