



Bitcoin Update: Selling pressure builds as BTC trades below 80k
Bitcoin has entered a difficult stretch, with the cryptocurrency now posting four consecutive bearish sessions and accumulating a decline of nearly -5.00% over this period. For now, prices continue to move further from the psychological 80k per BTC area, reflecting that selling pressure has managed to remain consistent.
Share this:

Bitcoin has entered a difficult stretch, with the cryptocurrency now posting four consecutive bearish sessions and accumulating a decline of nearly -5.00% over this period. For now, prices continue to move further from the psychological 80k per BTC area, reflecting that selling pressure has managed to remain consistent.
This scenario comes as appetite for risk assets such as BTC has started to face difficulties, partly due to the strength shown by substitute markets such as the global bond market. Therefore, as long as this fundamental factor remains relevant, selling pressure could continue to play a key role in Bitcoin price action over the coming trading sessions.


Demand begins to show signs of slowing
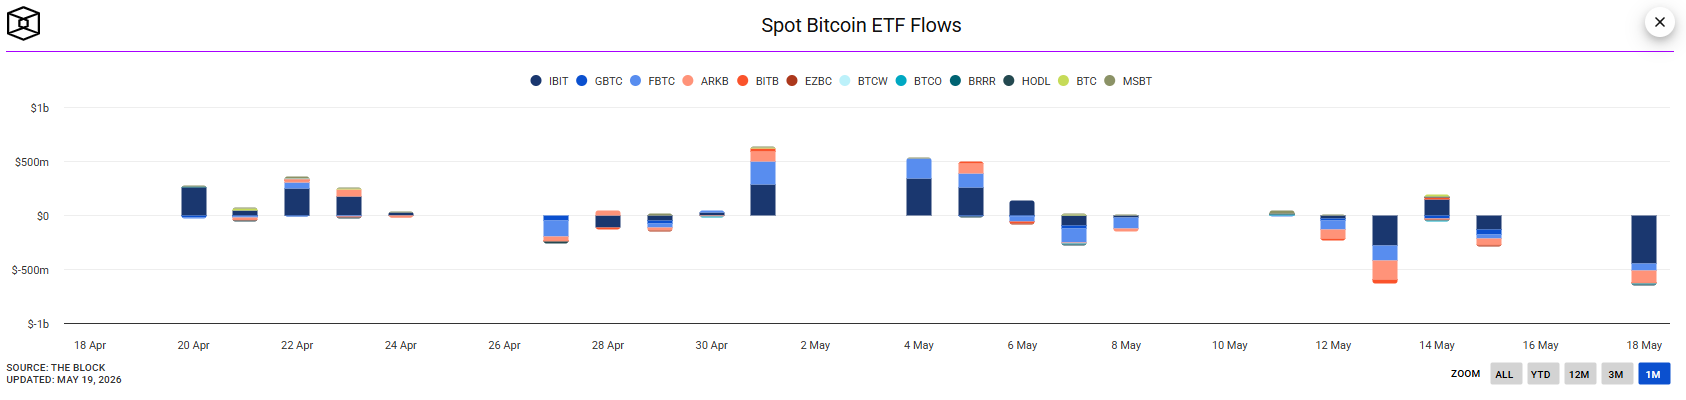
In recent trading sessions, flows into Bitcoin ETFs have started to show signs of weakness. In particular, during the May 18 session, outflows exceeded $600 million in a single day, marking the largest capital outflow of the past month. This behavior reflects a loss of strength in short-term demand and may be signaling lower appetite from market participants.
Source: theblock
This loss of demand coincides with a shift in US monetary policy expectations. The CME Group probability table shows that the market is already pricing in a probability above 40% that, by the December 9 decision, interest rates could rise from the current 3.75% level toward a new 4.00% reference.
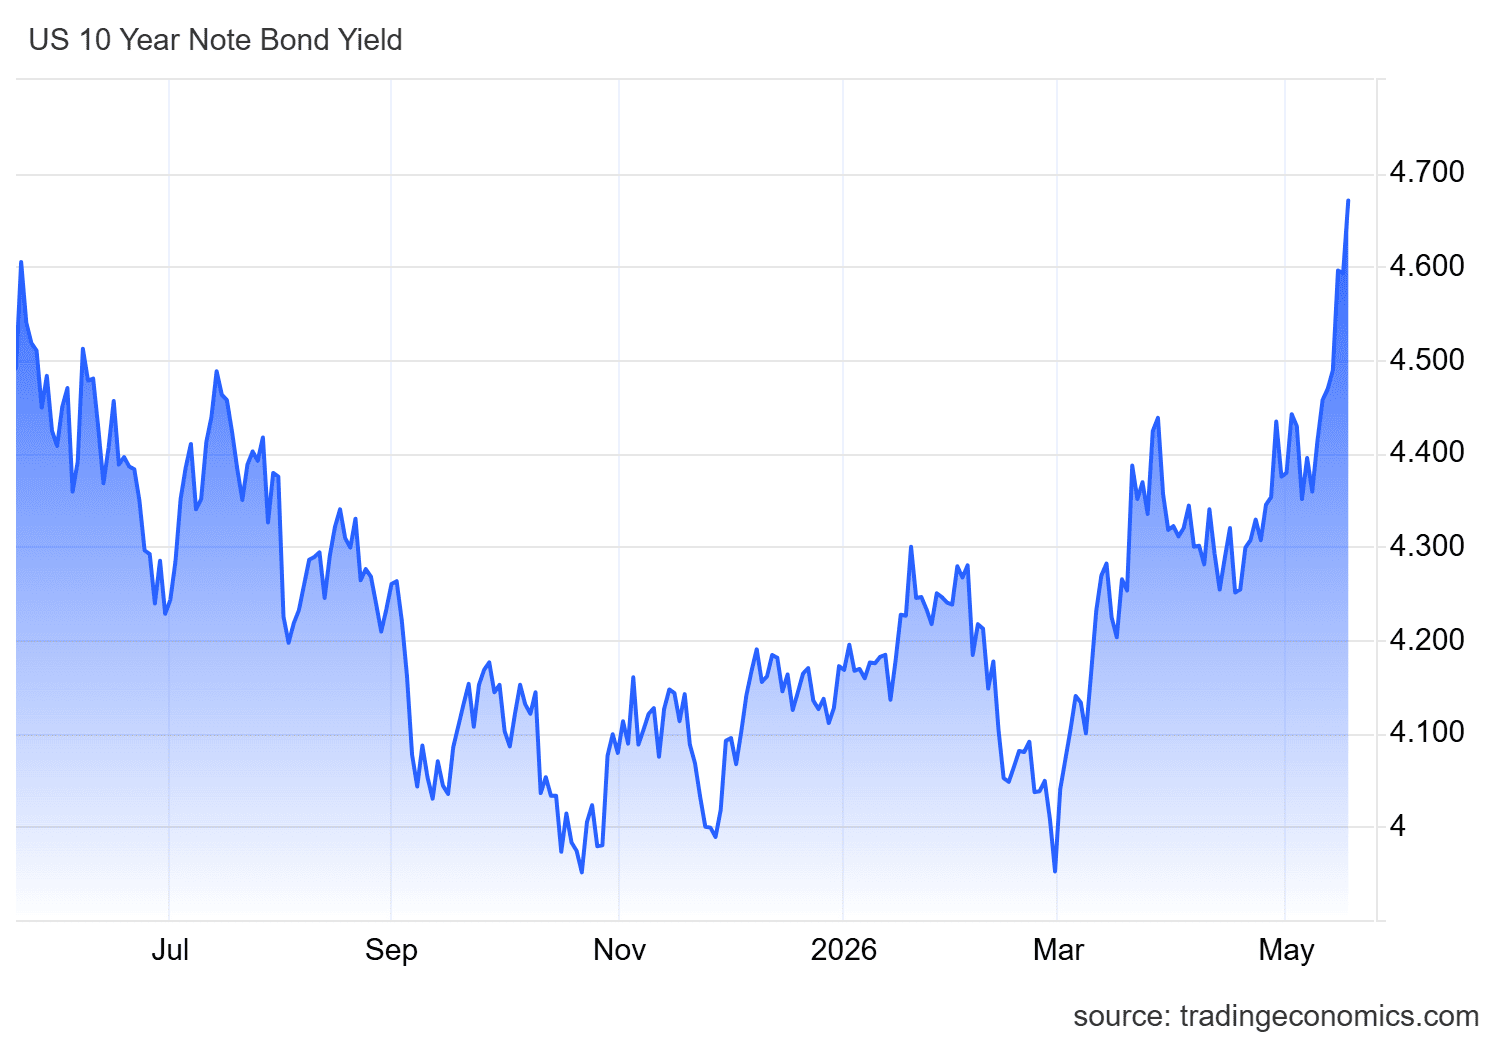
This scenario has strengthened the US bond market, where the 10-year Treasury yield is trading near 4.7%, levels not seen since the early days of 2025. This recovery in yields has increased the relative appeal of bonds compared with risk assets such as BTC. In addition, stronger yields have also supported the US dollar, with the DXY breaking above 99 points and moving closer to the psychological 100-point area.
Source: TradingEconomics
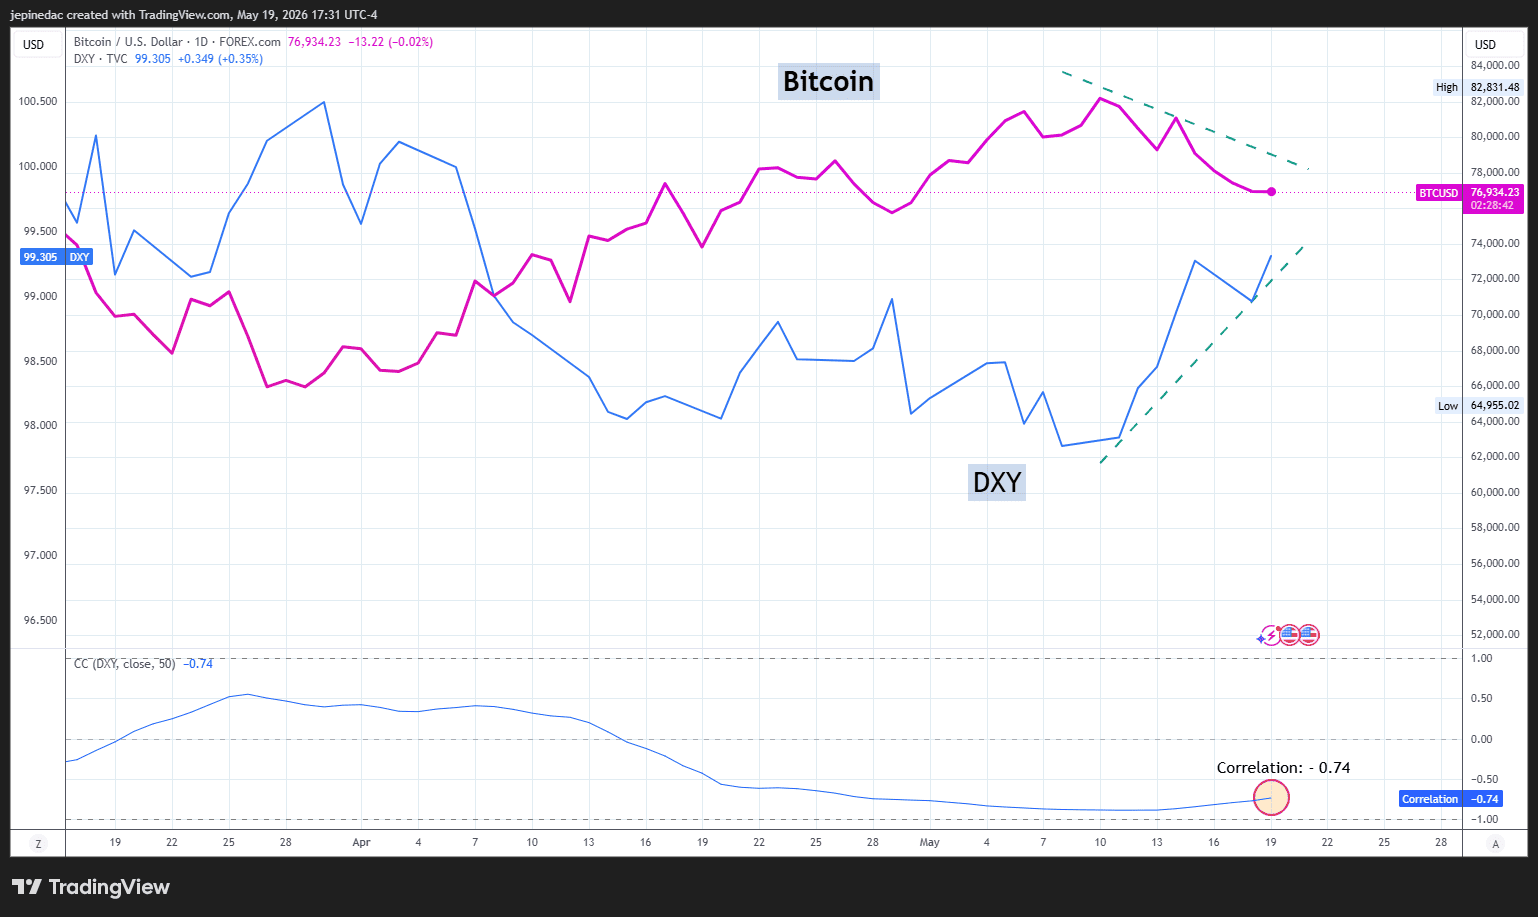
In this context, the inverse relationship between the US dollar and Bitcoin has become more evident. Currently, the correlation coefficient remains close to -0.74, indicating a relevant negative relationship between both markets. This suggests that, as the dollar strengthens, partly supported by the bond market, Bitcoin tends to show greater weakness in the short term. It is important to remember that correlation coefficients can change over time.
Source: StoneX,TVC, Tradingview
This dynamic reflects a loss of relative appeal for Bitcoin compared with more defensive markets, such as US bonds, which now offer more competitive yields. Therefore, if yields continue to show consistent appeal and the dollar maintains its strength, BTC could continue to face difficulties in recovering ground, keeping selling pressure relevant over the coming trading sessions.
Technical outlook for Bitcoin
Source: StoneX, Tradingview
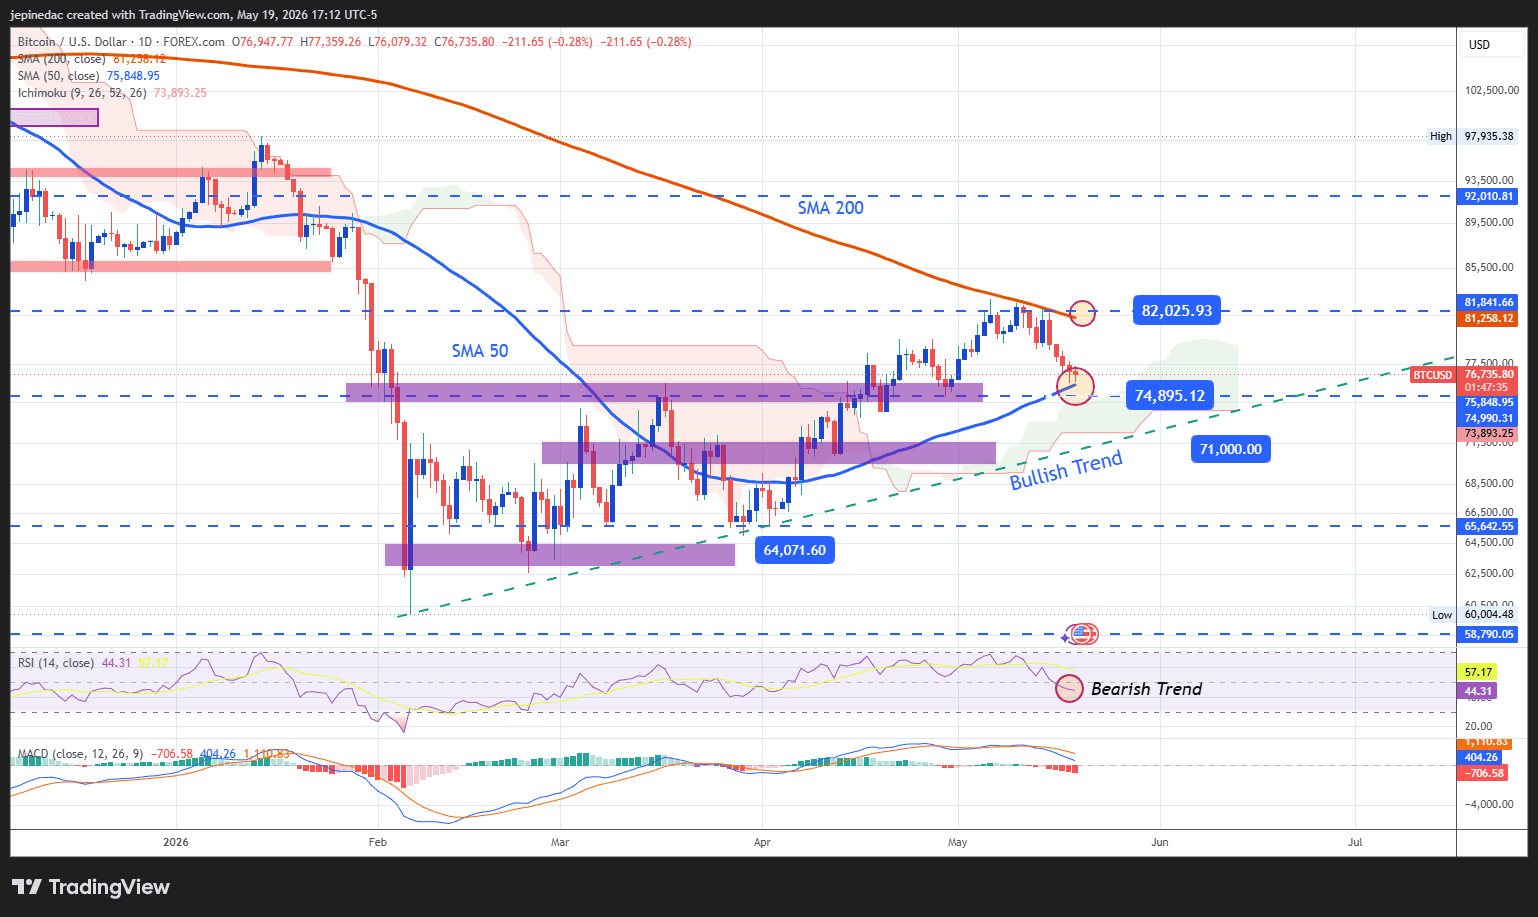
- Bullish trendline begins to show weakness: Over the past several weeks, Bitcoin had been forming a pattern of higher highs, which supports the development of a relevant short-term bullish trendline. However, the recent loss of strength has now pushed BTC toward important barriers that, if broken, could start to call into question the strength of this potential bullish trendline. As long as selling pressure remains relevant, the broader chart outlook could shift toward a more consistent phase of indecision over the coming weeks.
- MACD: Now, the MACD indicator maintains a histogram with movements below the 0 level, suggesting that the average strength of short-term moving averages remains in bearish territory. This behavior could continue to be relevant if selling pressure persists in BTC over the coming sessions.
- RSI: The RSI shows a similar scenario, as the indicator line remains below the 50 level. This indicates that short-term momentum is currently showing bearish dominance, which also highlights the relevance of potential selling pressure in the short term.
Key levels:
- 82,000 – Important resistance: A relevant high area that coincides with the 200-period moving average barrier. Moves toward this level could reinforce the dominance of the buying bias and, if broken with strength, open the door to a clearer extension of the short-term uptrend.
- 75,000 – Near-term barrier: A recent reference level that has acted as a retracement area in recent sessions and coincides with the 50-period simple moving average. Price action that remains too close to this point could intensify a phase of consistent indecision over the coming sessions.
- 71,000 – Definitive support: An area located below the 50-period moving average, currently standing as the most relevant downside barrier. Moves toward this level could reactivate selling pressure and call into question the recent structural shift, bringing a bearish bias back into focus.
Written by Julian Pineda, CFA, CMT – Market Analyst
Follow him on: @julianpineda25
Related tags:




The complete CFD trading experience
Award-winning platforms, competitive spreads, low commissions and dedicated support.
We live and breathe the markets and are dedicated to helping traders realise their ambitions as we continue to set the industry bar.
Economic calendar
Web Trader platform
Our sophisticated web-based platform is packed with features.
Related articles

Bitcoin Analysis: Is Uncertainty Returning to BTC?
Recent trading sessions have not been particularly supportive of a clear directional move in Bitcoin. This can be seen in the behavior of the price over the last four sessions, where fluctuations have remained close to 1.00% without establishing a consistent trend. As a result, a growing sense of neutrality is beginning to emerge around BTC.

Gold Dips Below Three-Month Uptrend, Bitcoin Pulls Back from Nine-Month High
Gold has dipped below its three-month uptrend, while Bitcoin has pulled back from a nine-month high as U.S. bond yields test levels last seen in 2004 and 2007. Risks build as Fed rate-hike expectations remain above 70%, while the Dollar Index holds near yearly highs.


Crypto Outlook: Altcoins Lead the Rally as Bitcoin Pauses
With only a few days left in September, the cryptocurrency market continues to show a constructive short-term outlook. The latest trading week has delivered meaningful gains across most major digital assets and, broadly speaking, the bullish bias remains the dominant force within the market.
StoneX Europe Ltd may make third party material available on this website which may contain information included but not limited to the conditions of financial markets. The material is for information purposes only and does not contain, and should not be construed as containing, investment advice and/or investment recommendation and/or an investment research and/or an offer of or solicitation for any transactions in financial instruments; any decision to enter into a specific transaction shall be made by the client following an assessment by him/her of their situation.
StoneX Europe Ltd makes no representation or warranty and assumes no liability as to the accuracy or completeness of the information provided, nor any loss arising from any investment based on a recommendation, forecast or other information supplied. You should always seek independent advice as to your suitability to speculate in any related markets and your ability to assume the associated risks, if you are at all unsure. We are not under any obligation to update any such material. Any opinion made may be personal to the author and may not reflect the opinion of StoneX Europe Ltd.