






Canadian Data on the Right Path
Canada released trade balance data for December this morning, and the data was better.
Share this:

Canada released its trade balance data for December earlier this morning, and the data was better than expected. The overall Trade Balance was C$-0.4B vs C$-0.8B expected, and an upwardly revised C$-1.2B last. This is the smallest deficit since a surplus in May 2019. After a dovish BOC meeting on January 23rd, Canadian data has beat expectations as Retail Sales, PPI, and Manufacturing PMI have come out better than expected. However, with fears of a loss of demand of oil because of the Coronavirus and a plunge in the price of oil over the last 2 weeks, the USD/CAD has remained bid.
Last week, we discussed how it may be time for USD/CAD to pull back after a solid advance and resistance ahead. THAT DID NOT HAPPEN!! The pair continued to move higher.
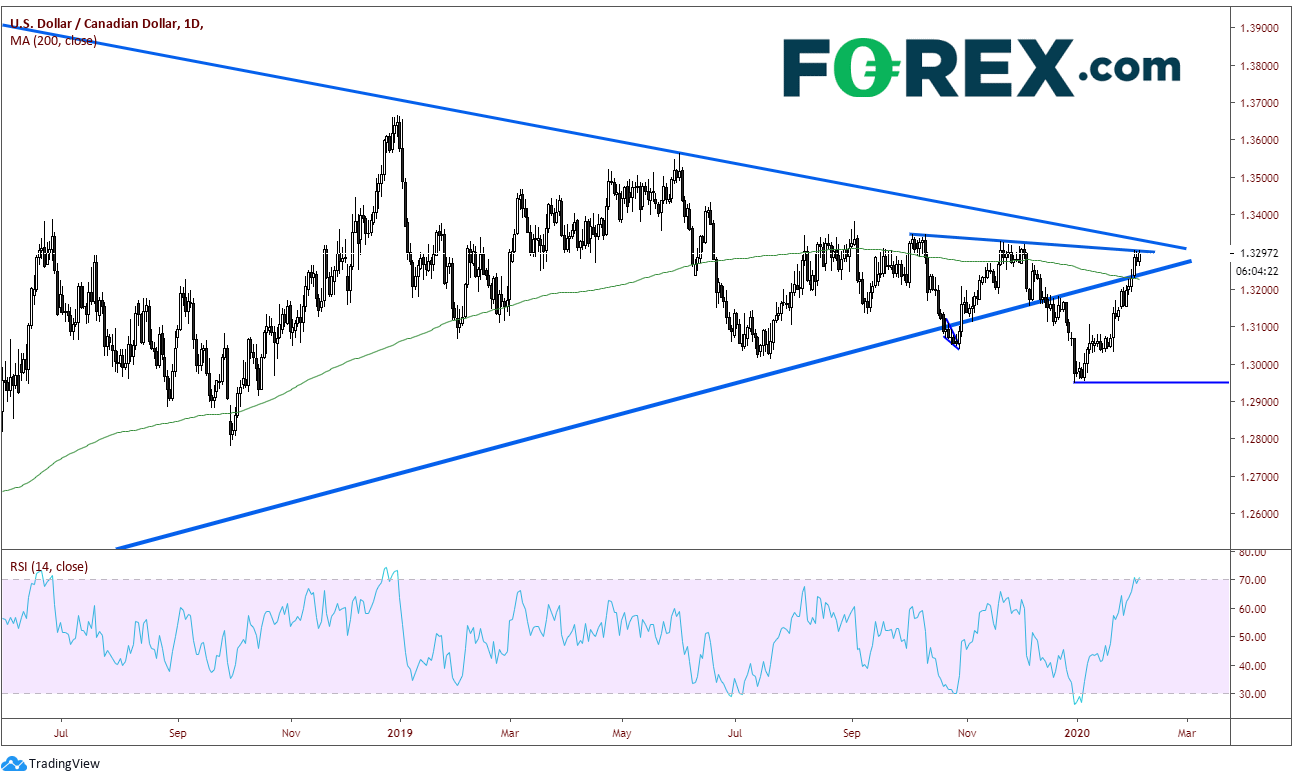
After breaking lower out of the long-term symmetrical triangle, the pair put in lows on December 31st, 2019 near 1.2950 and has been moving higher for the last month! USD/CAD pushed higher above the rising bottom trendline and back into the triangle. The pair also pushed back above the 200 Day Moving Average at 1.3228. USD/CAD is currently up against trendline resistance near 1.3300 with an RSI approaching overbought conditions.
Source: Tradingview, City Index
On a 240-minute chart, we can see the dovish BOC was the first catalyst to push USD/CAD substantially through resistance to the point where the pair formed a rising wedge at horizontal resistance, just above the 61.8% retracement level from the highs on November 20th to the lows on December 31st. As the price of the Loonie depends a great deal on the price of oil, USD/CAD continued to move higher as the price of oil moved lower. Above the 1.3300 trendline (on the daily), the next resistance level is a confluence of both the downward sloping triangle trendline on the daily and previous highs from November 20th near 1.3330. Horizontal support at the apex of the previously mentioned rising wedge near 1.3222. The level also coincides with the 200 Day Moving Average.
Source: Tradingview, City Index
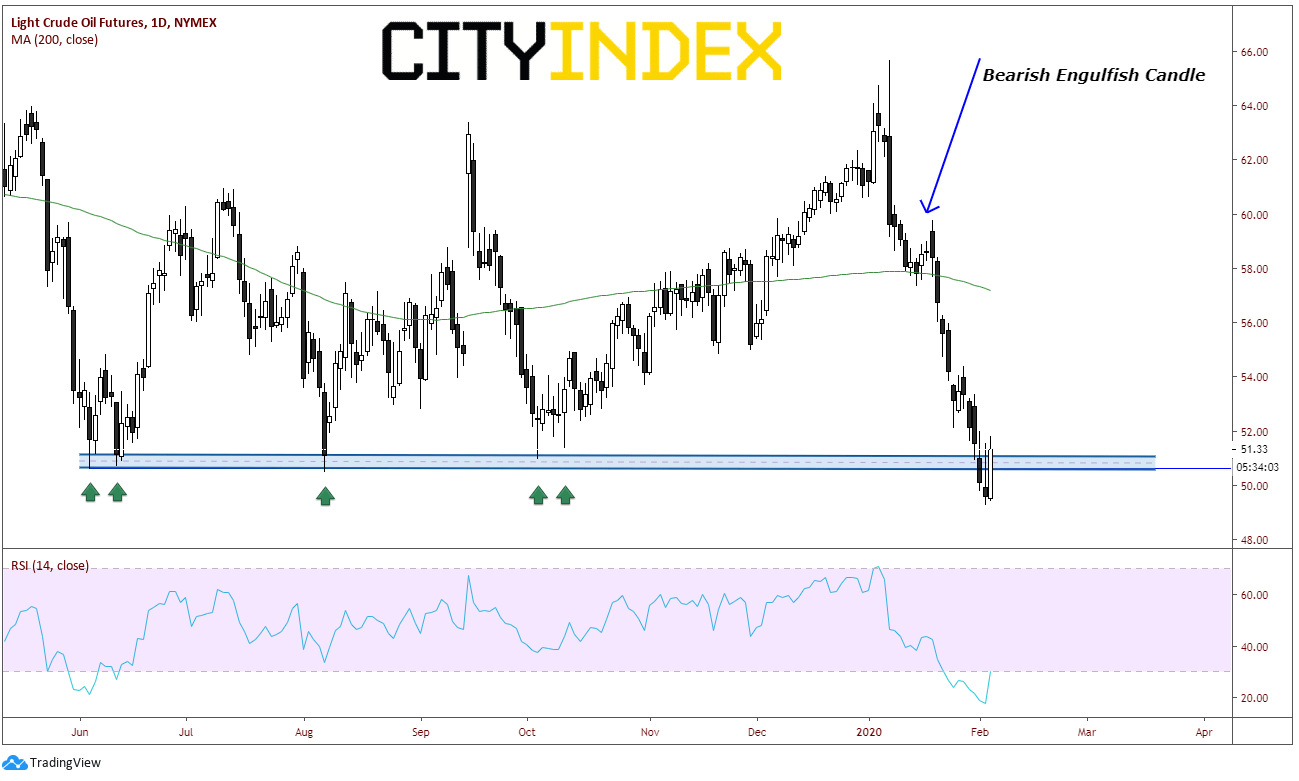
For your reference, below is a daily chart of Crude Futures. Notice the dramatic decline from 66.00 on January 7th (Iran attack on US Bases in Iraq) to yesterdays lows near 49.31. With today’s reversal, USD/CAD is able to pause its ascent.
Source: Tradingview, NYMEX, City Index
Although data has been better as of late, the price of crude oil has been the driving force behind the price of USD/CAD over the past month. And the price of Crude Oil has been guided by the fears of loss of demand due to the Coronavirus. On Friday, both Canada and the US will release employment data. If one is substantially better than the other, perhaps crude can pass the baton to economic data as the leader of price.
Canada released its trade balance data for December earlier this morning, and the data was better than expected. The overall Trade Balance was C$-0.4B vs C$-0.8B expected, and an upwardly revised C$-1.2B last. This is the smallest deficit since a surplus in May 2019. After a dovish BOC meeting on January 23rd, Canadian data has beat expectations as Retail Sales, PPI, and Manufacturing PMI have come out better than expected. However, with fears of a loss of demand of oil because of the Coronavirus and a plunge in the price of oil over the last 2 weeks, the USD/CAD has remained bid.
Last week, we discussed how it may be time for USD/CAD to pull back after a solid advance and resistance ahead. THAT DID NOT HAPPEN!! The pair continued to move higher.
After breaking lower out of the long-term symmetrical triangle, the pair put in lows on December 31st, 2019 near 1.2950 and has been moving higher for the last month! USD/CAD pushed higher above the rising bottom trendline and back into the triangle. The pair also pushed back above the 200 Day Moving Average at 1.3228. USD/CAD is currently up against trendline resistance near 1.3300 with an RSI approaching overbought conditions.
Source: Tradingview, FOREX.COM
On a 240-minute chart, we can see the dovish BOC was the first catalyst to push USD/CAD substantially through resistance to the point where the pair formed a rising wedge at horizontal resistance, just above the 61.8% retracement level from the highs on November 20th to the lows on December 31st. As the price of the Loonie depends a great deal on the price of oil, USD/CAD continued to move higher as the price of oil moved lower. Above the 1.3300 trendline (on the daily), the next resistance level is a confluence of both the downward sloping triangle trendline on the daily and previous highs from November 20th near 1.3330. Horizontal support at the apex of the previously mentioned rising wedge near 1.3222. The level also coincides with the 200 Day Moving Average.
Source: Tradingview, FOREX.COM
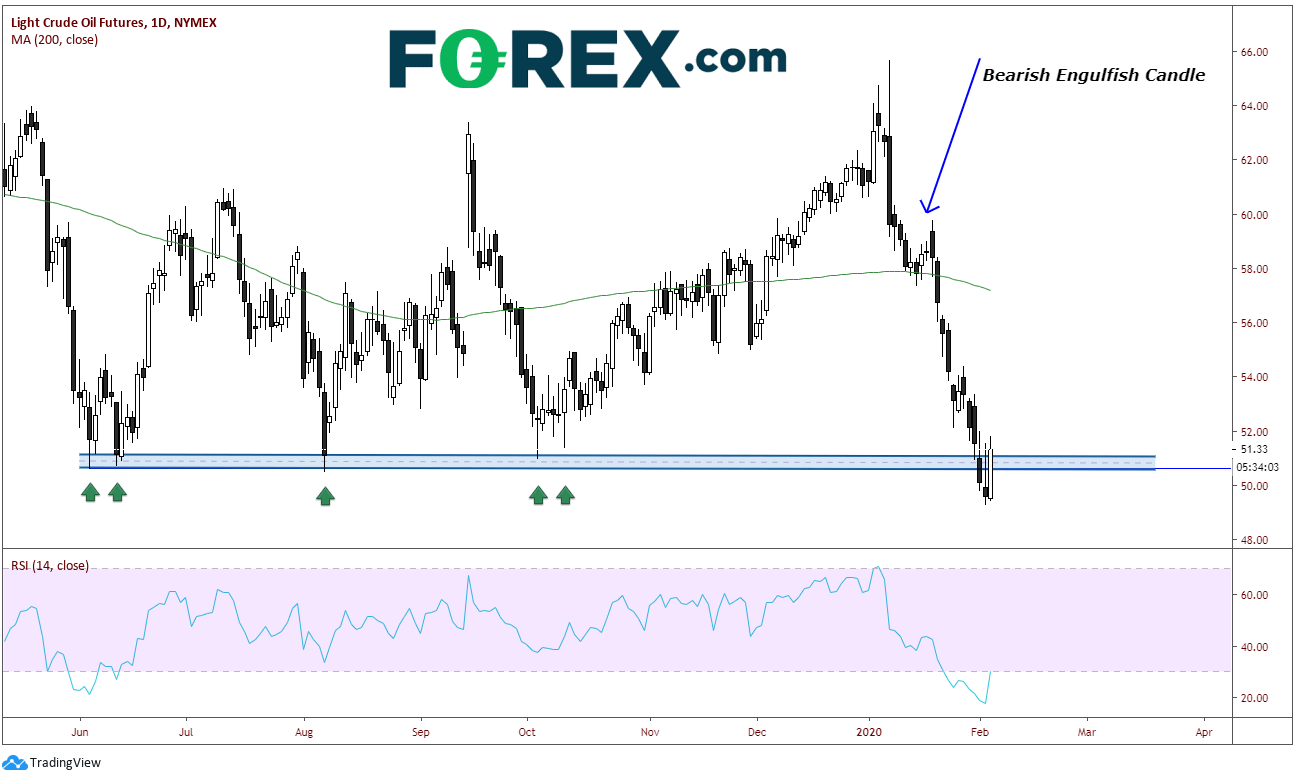
For your reference, below is a daily chart of Crude Futures. Notice the dramatic decline from 66.00 on January 7th (Iran attack on US Bases in Iraq) to yesterdays lows near 49.31. With today’s reversal, USD/CAD is able to pause its ascent.
Source: Tradingview, NYMEX, FOREX.COM
Although data has been better as of late, the price of crude oil has been the driving force behind the price of USD/CAD over the past month. And the price of Crude Oil has been guided by the fears of loss of demand due to the Coronavirus. On Friday, both Canada and the US will release employment data. If one is substantially better than the other, perhaps crude can pass the baton to economic data as the leader of price.
Related tags:


The complete CFD trading experience
Award-winning platforms, competitive spreads, low commissions and dedicated support.
We live and breathe the markets and are dedicated to helping traders realise their ambitions as we continue to set the industry bar.
Economic calendar
Web Trader platform
Our sophisticated web-based platform is packed with features.
Related articles
GBP/USD, Oil Forecast: Two trades to watch 300926
GBP/USD: Can Stronger UK Growth Offset the Dollar’s Advantage? Oil: Supply Recovery Challenges the Geopolitical Premium.

NZD/USD pressure mounts as payrolls looms large
NZD/USD has fallen sharply as Fed rate expectations reset higher, but extreme downside stretch and major support raise the risk of a violent counter-trend rebound.


US Core PCE Preview: Stale or Significant for the Fed
Core PCE inflation takes center stage Wednesday, with traders watching for signs of renewed price pressure and clues on whether the Fed could hike again in October.

StoneX Europe Ltd may make third party material available on this website which may contain information included but not limited to the conditions of financial markets. The material is for information purposes only and does not contain, and should not be construed as containing, investment advice and/or investment recommendation and/or an investment research and/or an offer of or solicitation for any transactions in financial instruments; any decision to enter into a specific transaction shall be made by the client following an assessment by him/her of their situation.
StoneX Europe Ltd makes no representation or warranty and assumes no liability as to the accuracy or completeness of the information provided, nor any loss arising from any investment based on a recommendation, forecast or other information supplied. You should always seek independent advice as to your suitability to speculate in any related markets and your ability to assume the associated risks, if you are at all unsure. We are not under any obligation to update any such material. Any opinion made may be personal to the author and may not reflect the opinion of StoneX Europe Ltd.