




Chinese Concept Stocks with Promising Signals
Among the Chinese concept stocks listed in the US, NIO (NIO), JOYY (YY) and Sina (SINA) show promising technical signals...
Share this:

NIO (NIO): Strong Bullish Momentum
Source: TradingView, Gain Capital
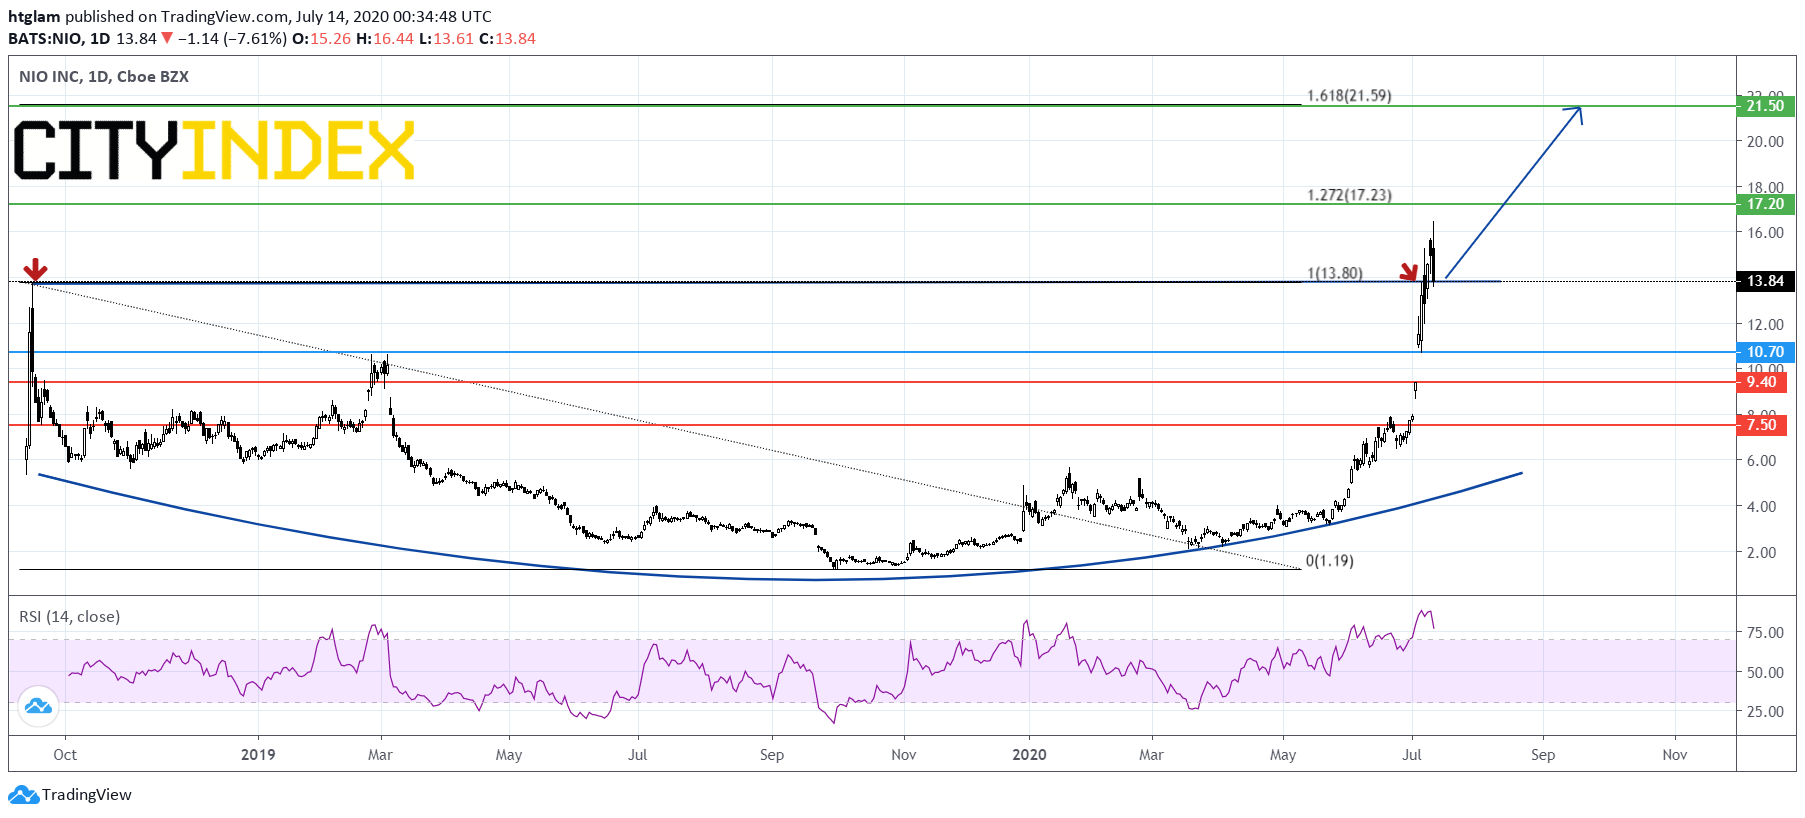
NIO (NIO), a Chinese electric vehicle manufacturer, has surpassed its historical after forming a rounding bottom pattern as shown on the daily chart. For the stock to maintain its strong bullish momentum, the 61.8% Fibonacci retracement level of the rally from March at $10.70 should act as the nearest support, with prices trending to test the 1st and 2nd resistance at $17.20 and $21.50 respectively. Alternatively, a break below $10.70 might trigger a pull-back to the next support at $9.40.
JOYY (YY): Long-term Rounded Bottom
Source: TradingView, Gain Capital
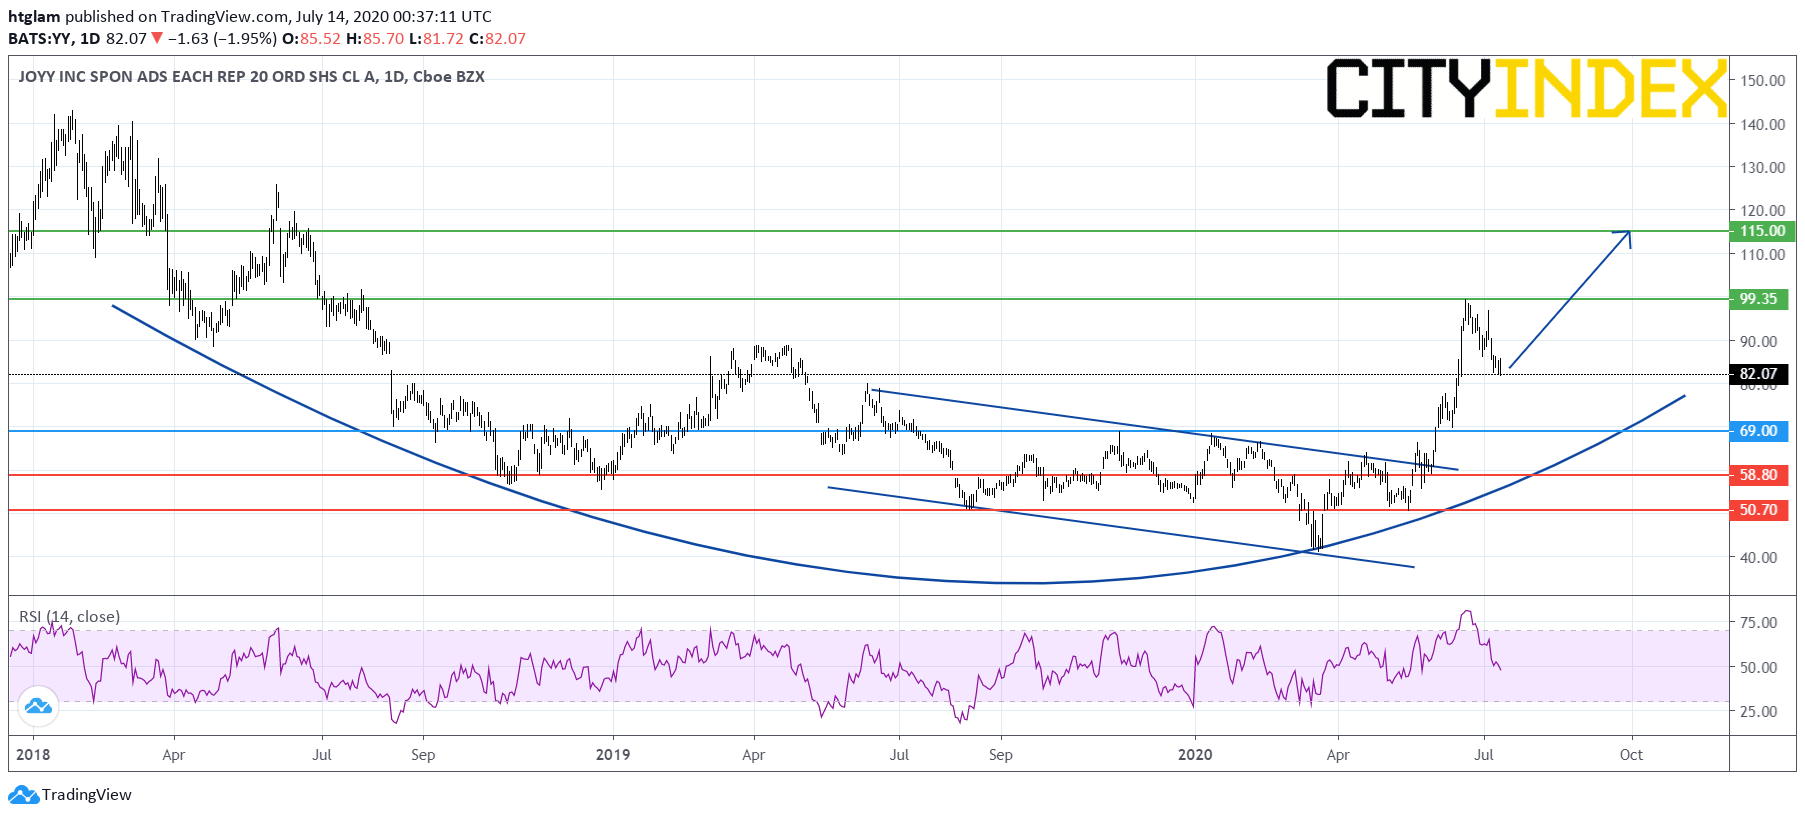
JOYY (YY), a Chinese video-based social network, has accelerated to the upside after breaking above a bearish channel as shown on the daily chart. In fact, it is building a rounding bottom pattern in the longer term. Despite a modest pull-back, the level at $69.00 might be considered as the nearest support, while a break above the nearest resistance at $99.35 would open a path to the next resistance at $115.00. Alternatively, losing $69.00 would suggest that the next support at $58.80 is exposed.
Sina (SINA): Promising Rebound Pattern
Source: TradingView, Gain Capital
Sina (SINA), a Chinese technology company, is gathering upside momentum after breaking above a bullish falling wedge pattern as shown on the daily chart. In fact, it has now broken above an ascending triangle and as long as the key support level at $34.50 holds, the 1st and 2nd resistances at $44.90 and $49.40 are likely to be tested. Alternatively, below $34.50, a downside correction to the next support at $30.00 may be due.
NIO (NIO): Strong Bullish Momentum
Source: TradingView, Gain Capital
NIO (NIO), a Chinese electric vehicle manufacturer, has surpassed its historical after forming a rounding bottom pattern as shown on the daily chart. For the stock to maintain its strong bullish momentum, the 61.8% Fibonacci retracement level of the rally from March at $10.70 should act as the nearest support, with prices trending to test the 1st and 2nd resistance at $17.20 and $21.50 respectively. Alternatively, a break below $10.70 might trigger a pull-back to the next support at $9.40.
JOYY (YY): Long-term Rounded Bottom
Source: TradingView, Gain Capital
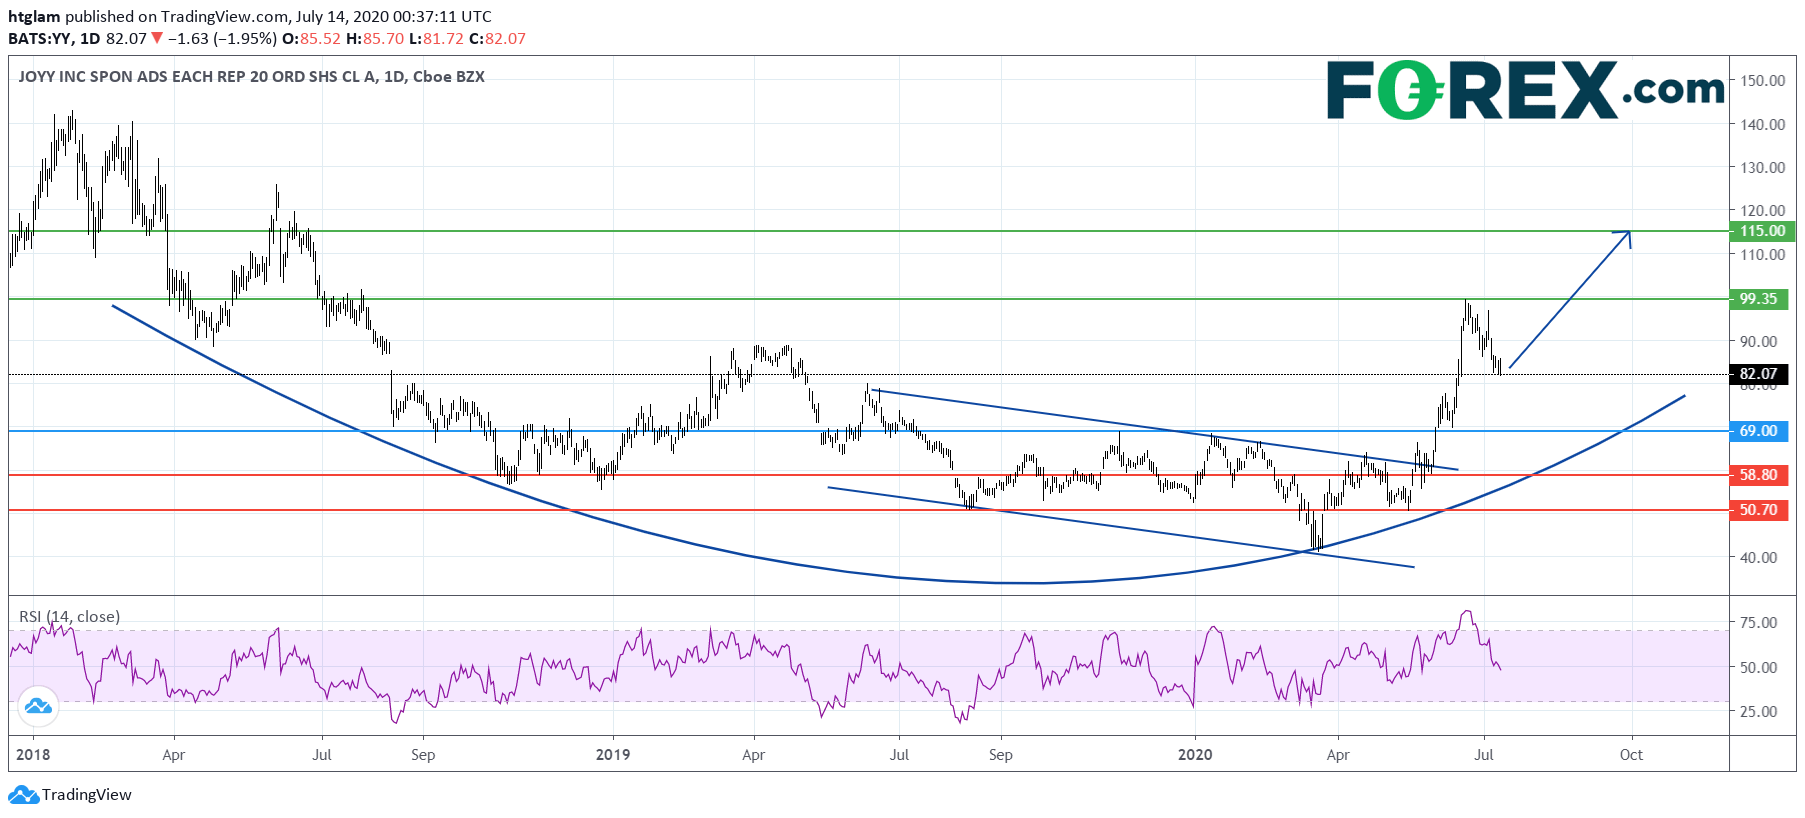
JOYY (YY), a Chinese video-based social network, has accelerated to the upside after breaking above a bearish channel as shown on the daily chart. In fact, it is building a rounding bottom pattern in the longer term. Despite a modest pull-back, the level at $69.00 might be considered as the nearest support, while a break above the nearest resistance at $99.35 would open a path to the next resistance at $115.00. Alternatively, losing $69.00 would suggest that the next support at $58.80 is exposed.
Sina (SINA): Promising Rebound Pattern
Source: TradingView, Gain Capital
Sina (SINA), a Chinese technology company, is gathering upside momentum after breaking above a bullish falling wedge pattern as shown on the daily chart. In fact, it has now broken above an ascending triangle and as long as the key support level at $34.50 holds, the 1st and 2nd resistances at $44.90 and $49.40 are likely to be tested. Alternatively, below $34.50, a downside correction to the next support at $30.00 may be due.
Related tags:




The complete CFD trading experience
Award-winning platforms, competitive spreads, low commissions and dedicated support.
We live and breathe the markets and are dedicated to helping traders realise their ambitions as we continue to set the industry bar.
Economic calendar
Web Trader platform
Our sophisticated web-based platform is packed with features.
Related articles

Nasdaq 100 Forecast: NDX falls as oil jumps and Treasury yields rise
U.S. stocks are pointing to a weaker open on Monday after President Trump rejected an Iranian ceasefire, sending oil prices higher and fuelling inflationary concerns and pushing Treasury yields higher.


S&P 500, Nasdaq, Dow Forecast: Wall Street Split Widens Into Month-End 9 26 2026
Nasdaq strength contrasts with mounting Dow pressure as rising Treasury yields raise the stakes for stocks heading into the monthly close.


Equity Indices Q4, 2026 Outlook: Cracks Begin to Show
There's still an open door for a melt-up in the S&P 500 and Nasdaq but the Dow and Russell 2000 are looking more vulnerable, and until calm hits the Treasuries market there's a higher probability for volatility. The big question is whether that's a next quarter theme or not.

StoneX Europe Ltd may make third party material available on this website which may contain information included but not limited to the conditions of financial markets. The material is for information purposes only and does not contain, and should not be construed as containing, investment advice and/or investment recommendation and/or an investment research and/or an offer of or solicitation for any transactions in financial instruments; any decision to enter into a specific transaction shall be made by the client following an assessment by him/her of their situation.
StoneX Europe Ltd makes no representation or warranty and assumes no liability as to the accuracy or completeness of the information provided, nor any loss arising from any investment based on a recommendation, forecast or other information supplied. You should always seek independent advice as to your suitability to speculate in any related markets and your ability to assume the associated risks, if you are at all unsure. We are not under any obligation to update any such material. Any opinion made may be personal to the author and may not reflect the opinion of StoneX Europe Ltd.