


EUR/USD & Nasdaq Forecast: Breakout Scenarios Ahead
EUR/USD and Nasdaq forecast as softer US inflation, strong earnings, and Hormuz tensions shape markets. Key support, resistance, and breakout levels to watch.
Share this:

As markets digest softer US inflation data, stronger-than-expected corporate earnings, and renewed Middle East tensions, consolidations across major asset classes continue to develop, creating key technical scenarios to watch for the next directional breakout.
Markets remain caught between improving inflation data and rising geopolitical risks. US CPI eased from 4.2% to 3.5%, while US PPI fell to its lowest level since 2025 at -0.3%. At the same time, renewed tensions around the Strait of Hormuz continue to support crude oil prices near $80 while raising concerns over global shipping conditions heading into the second half of the year. Transit risks and shipping costs through Hormuz remain elevated, with volumes yet to return to full capacity, delaying a broader recovery across global supply chains, energy markets, and commercial activity.

Although ASML reported stronger-than-expected earnings, reinforcing the resilience of AI-related investment, the Nasdaq continues to trade within a one-and-a-half-month consolidation that has recently begun to lean modestly to the downside. As the well-known technical analysis principle suggests, the longer a consolidation persists, the more significant the eventual breakout is likely to be. This continues to highlight the importance of the Nasdaq's current technical setup, which I discussed in my latest webinar and illustrate in the chart below.
In the currency markets, the US Dollar Index (DXY) has begun unwinding part of its recent bullish momentum following the larger-than-expected decline in US inflation. This has allowed major currency pairs to recover, although only toward key resistance levels. EUR/USD, for example, continues to struggle near the 1.1480 resistance while the DXY tests the critical 100.30 support level, which aligns with the golden Fibonacci retracement of the June 15-June 25 advance.
EUR/USD Forecast: Weekly Time Frame – Log Scale
Source: TradingView
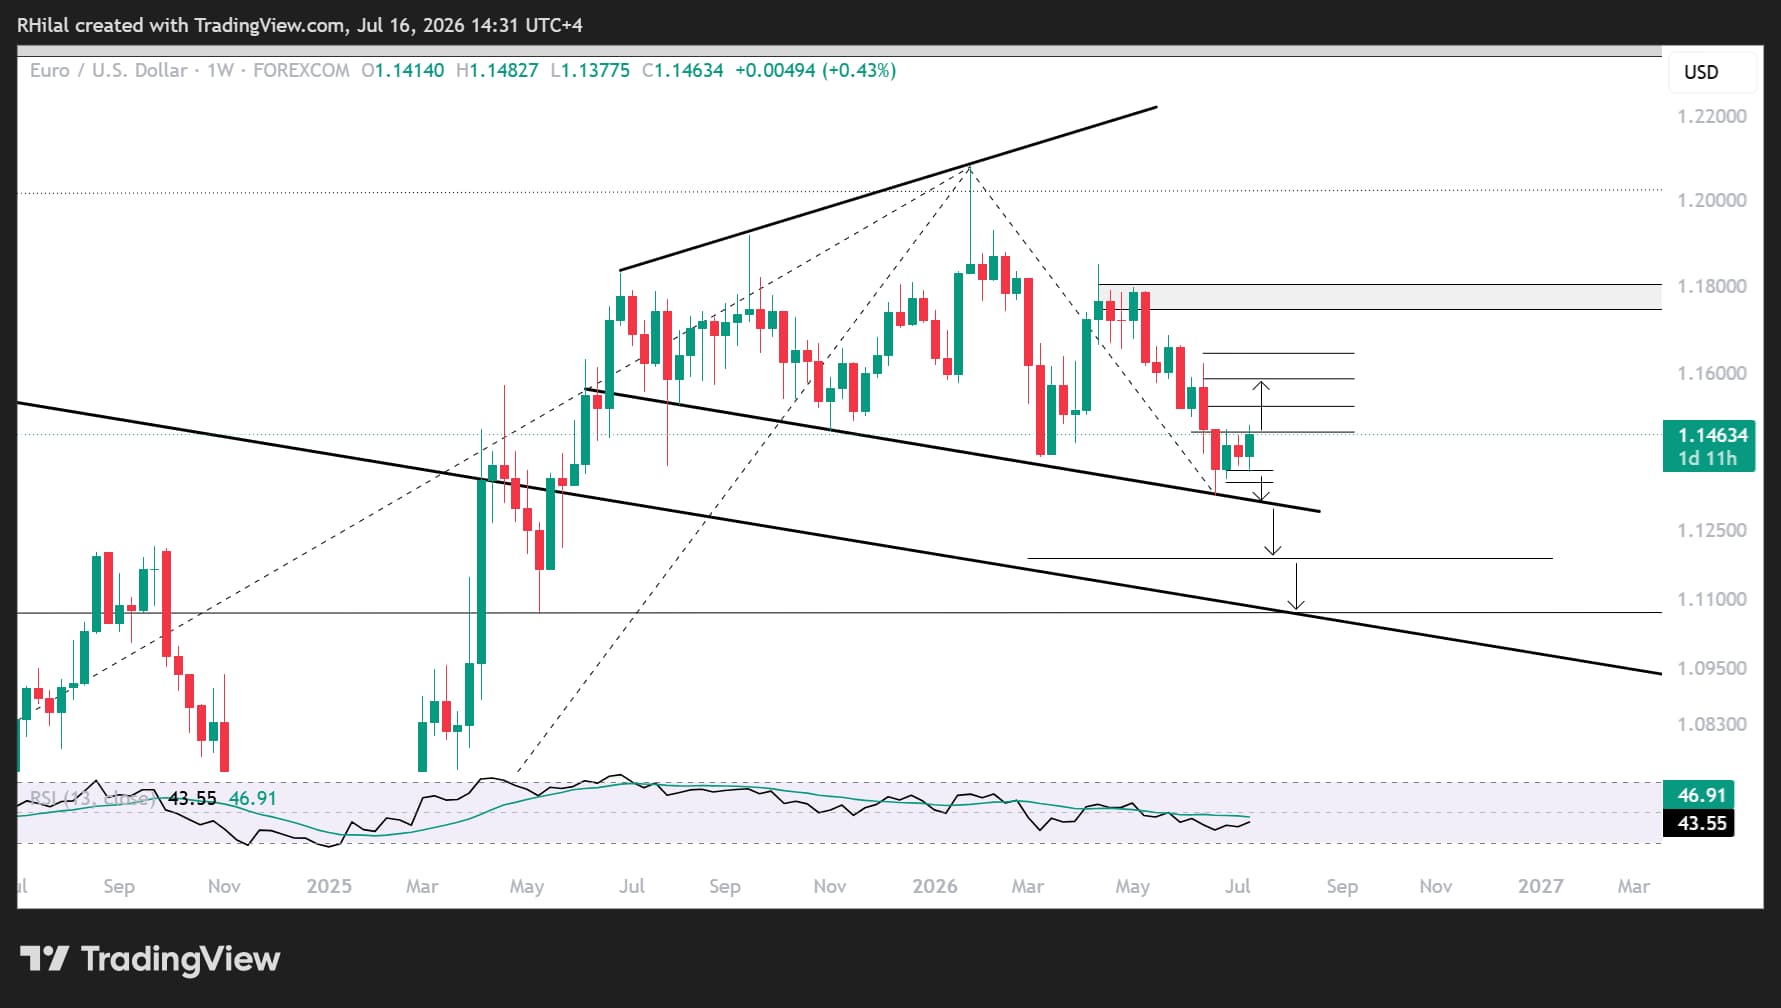
EUR/USD continues to trade below the 27.2% Fibonacci retracement of the April-June decline near 1.1480, after rebounding from the descending trendline connecting lower lows since August 2025, while the DXY continues to hold above the 100.30 support.
Bullish scenario (likely to remain limited while weekly momentum retests the neutral 50 level from below)
A breakout above 1.1480, corresponding to the 27.2% Fibonacci retracement, would expose the following upside targets:
- 1.1530 – 38.2% Fibonacci retracement.
- 1.1590 – 50% Fibonacci retracement.
- 1.1650 – 61.8% Fibonacci retracement, representing a high-probability pullback zone. A sustained break above this level would significantly increase confidence in a broader bullish continuation toward the 1.1800 region.
Bearish scenario
A breakdown below the 1.1300-1.1280 support zone would confirm a decisive break below the August 2025-July 2026 consolidation range, exposing the pair to:
- 1.1180.
- 1.1070, corresponding to the May 2025 low and the upper boundary of the well-respected 2008-2025 channel.
Nasdaq Forecast: Daily Time Frame – Log Scale
Source: TradingView
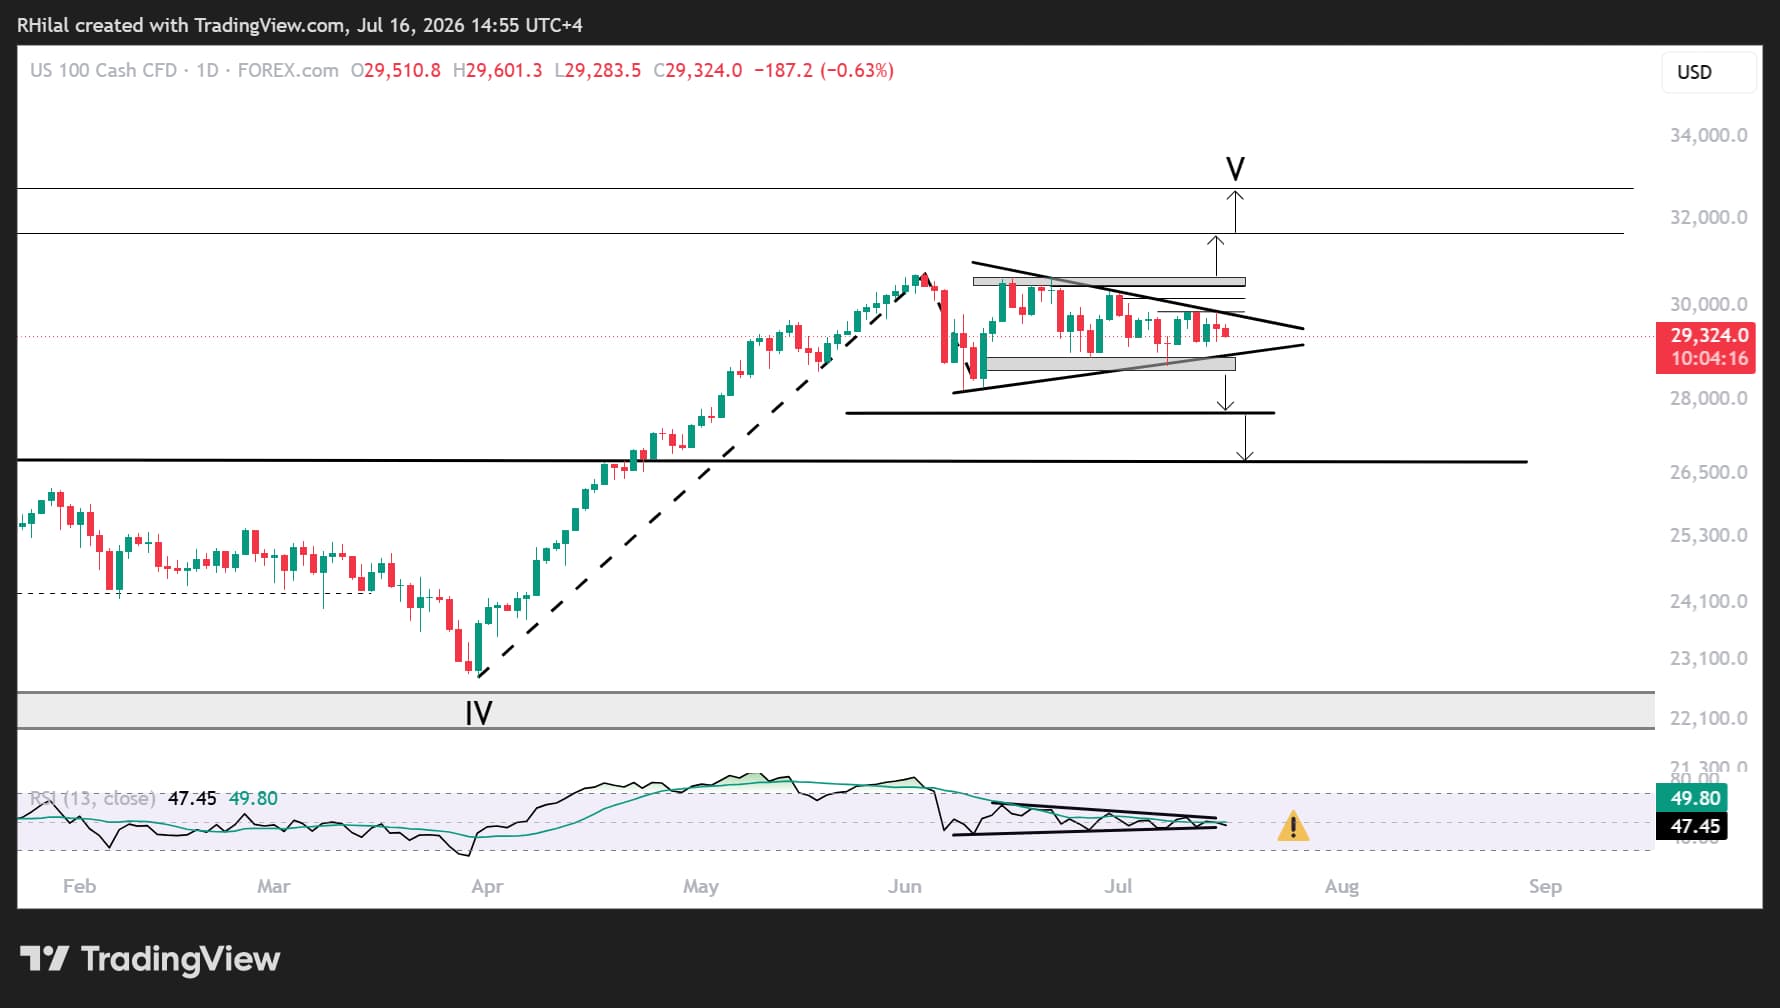
Despite ASML's earnings beat, the Nasdaq continues to consolidate with a neutral-to-bearish bias as valuation concerns persist within a higher-for-longer interest rate environment.
The longer this consolidation continues, the greater the probability of a significant breakout. Based on the current structure, the measured move suggests a potential range of approximately 1,000-2,000 points in either direction, depending on confirmation from both price action and the RSI trend.
Bullish breakout scenario
A breakout above the descending resistance connecting the lower highs since June 22, beginning with a move above 28,900, would expose:
- 30,100.
- 30,400.
- 30,600.
These levels will determine whether the index experiences another major pullback or confirms a bullish breakout toward:
- 31,700.
- 32,700.
These upside objectives align with the Fibonacci extension levels of the broader trend spanning 2024-2026.
Bearish breakout scenario
A breakdown below the 28,800-28,600 support zone, which aligns with the 27.2% Fibonacci retracement of the March-June advance, would expose:
- 27,700 – 38.2% Fibonacci retracement.
- 26,700 – 50% Fibonacci retracement.
This area represents a high-probability rebound zone, particularly if accompanied by oversold momentum conditions similar to those recorded near the yearly lows.
Key Takeaway
The evolving shipping landscape, including transit tolls, freight insurance costs, and war-related risks around the Strait of Hormuz, has yet to be fully reflected in market pricing. As a result, a cautious outlook remains appropriate until greater clarity emerges regarding regional stability.
The two key charts to monitor for early signals of a broader market shift remain crude oil and the US Dollar Index, as both continue to drive intermarket relationships across currencies, equities, commodities, and broader risk sentiment.
Written by Razan Hilal, CMT
Follow on X: @Rh_waves
Related tags:


The complete CFD trading experience
Award-winning platforms, competitive spreads, low commissions and dedicated support.
We live and breathe the markets and are dedicated to helping traders realise their ambitions as we continue to set the industry bar.
Economic calendar
Web Trader platform
Our sophisticated web-based platform is packed with features.
Related articles
EUR/USD, GBP/USD Outlook: RSI Hits 2020 Oversold Levels
EUR/USD, GBP/USD Outlook: The EUR/USD daily RSI has fallen to oversold levels last seen in 2020, raising the risk of a reversal across correlated currency pairs, including the US dollar and GBP/USD.

Dow Jones forecast: Stock markets under pressure from multiple sources
When looking at the major tech-heavy US indices like the S&P 500 or the Nasdaq 100, you wouldn’t think that the stock market is particularly weak. Yet, beneath the surface, the market is far from healthy right now. Investors are evidently just piling into the big tech and AI names, and as a result, market breadth is deteriorating. Other indices like the small cap Russell 2000 and the Dow Jones are starting to reflect that weakness.


Nikkei breakout accelerates as yen weakness returns
Nikkei has started October with a powerful breakout, helped by renewed yen weakness and strong upside momentum

StoneX Europe Ltd may make third party material available on this website which may contain information included but not limited to the conditions of financial markets. The material is for information purposes only and does not contain, and should not be construed as containing, investment advice and/or investment recommendation and/or an investment research and/or an offer of or solicitation for any transactions in financial instruments; any decision to enter into a specific transaction shall be made by the client following an assessment by him/her of their situation.
StoneX Europe Ltd makes no representation or warranty and assumes no liability as to the accuracy or completeness of the information provided, nor any loss arising from any investment based on a recommendation, forecast or other information supplied. You should always seek independent advice as to your suitability to speculate in any related markets and your ability to assume the associated risks, if you are at all unsure. We are not under any obligation to update any such material. Any opinion made may be personal to the author and may not reflect the opinion of StoneX Europe Ltd.