





Euro Taking It on the Chin a
EUR/GBP has been getting slammed all day
Share this:

With the DXY going bid most of the US session because of positive China-US trade talk headlines, it’s only natural for the EUR/USD to have sold off today. The Euro currently makes up about 57% of the US Dollar Index. Currently EUR/USD is down -.55% at 1.1066. With the DXY up +.41% on the day, one may expect GBP/USD to be lower as well. However, the pair is actually just about unchanged. Granted, Sterling makes up only about 12% of the DXY, however usually if EUR/USD were to move lower, the GBP/USD would follow suit. There were no major headlines today regarding Brexit, so that isn’t why GBP/USD is holding up. However, if EUR/USD is falling, and GBP/USD is unchanged, something has to give. The answer lies in the cross currency, EUR/GBP!
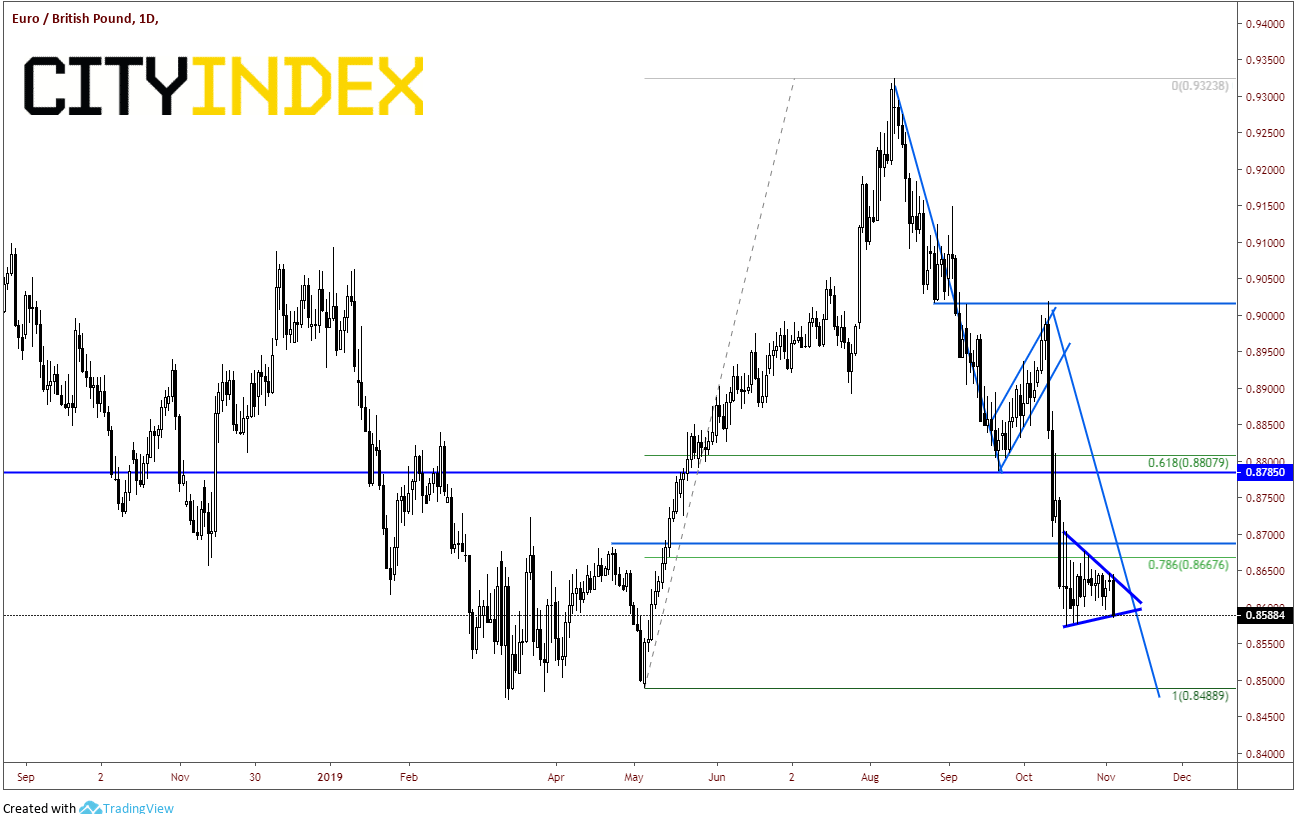
EUR/GBP has been getting slammed all day, which means the Euro is heading lower while the Pound is going higher. The cross currency is currently down nearly -.60% at .8685 (down 50 pips on the day). The pair formed a flag pattern on a daily timeframe during the month of September and halted its selloff from the break lower towards the flag target at .8488. The pair has been forming a symmetrical triangle since mid-October between .8580 and .8700 and is currently trading near the apex.
Source: Tradingview, City Index
On a 240-minute chart the symmetrical is clearer, and it looks as if EUR/GBP is trying to push through the lower trendline of the triangle. If this is the case, the target is close to .8400 (whereas the target from the flag on the daily is .8488.)
Source: Tradingview, City Index
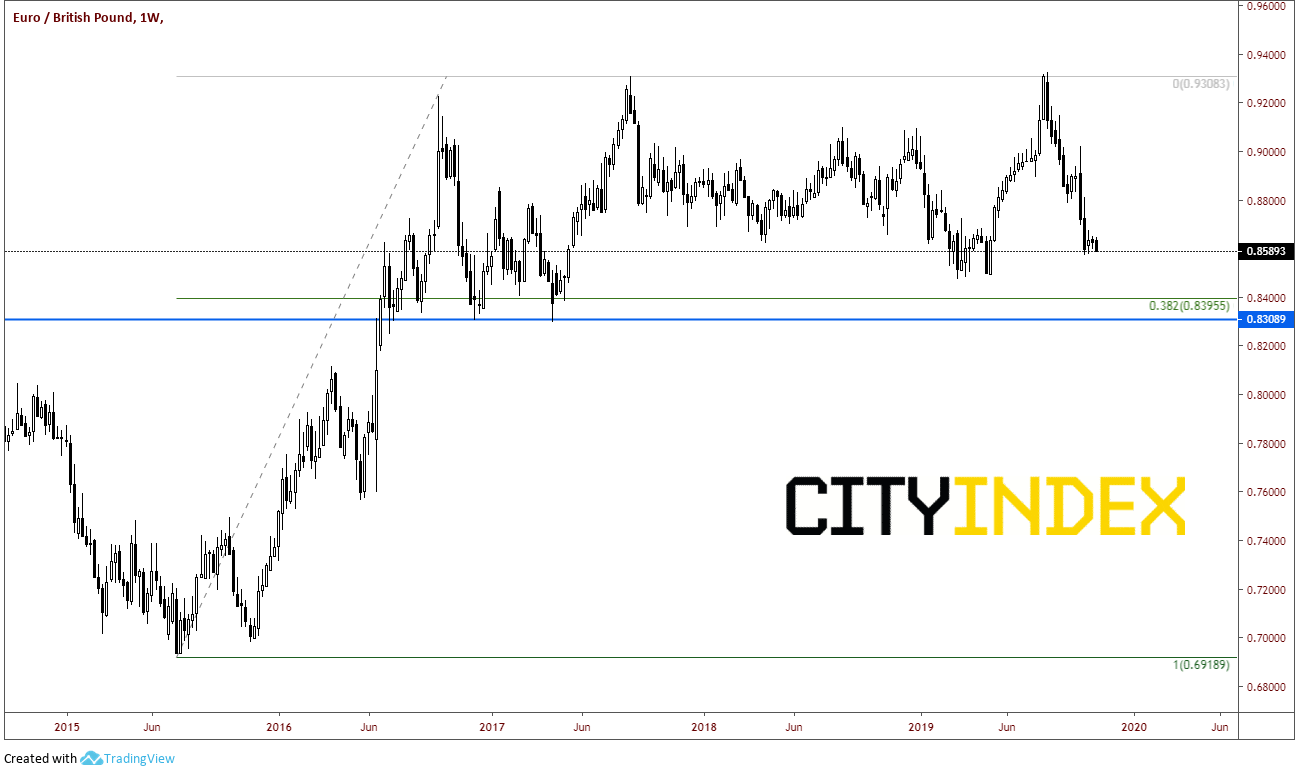
Looking at the daily chart, there isn’t any support until the daily flag target, which is also lows from March and May, near .8475/.8500. To find support below there, we need to look at a weekly chart. The 38.2% retracement level from the lows of July 2015 to the highs in August 2019 is .8400 (which is also the target of the triangle on the 240-minute chart. Below there, horizontal support comes across at .8308.
Source: Tradingview, City Index
If EUR/GBP does manage to hold within the triangle and bounce, resistance would be at the top, downward sloping trendline from the triangle near .8640. Above that, there is horizontal resistance at .8715.
Brexit headlines are usually key for movements in EUR/GBP. However, with campaigning for elections ongoing, headlines may be sparse for a while, which may keep GBP/USD steady. As we see today though, movement may come via EUR/USD and China headlines!
With the DXY going bid most of the US session because of positive China-US trade talk headlines, it’s only natural for the EUR/USD to have sold off today. The Euro currently makes up about 57% of the US Dollar Index. Currently EUR/USD is down -.55% at 1.1066. With the DXY up +.41% on the day, one may expect GBP/USD to be lower as well. However, the pair is actually just about unchanged. Granted, Sterling makes up only about 12% of the DXY, however usually if EUR/USD were to move lower, the GBP/USD would follow suit. There were no major headlines today regarding Brexit, so that isn’t why GBP/USD is holding up. However, if EUR/USD is falling, and GBP/USD is unchanged, something has to give. The answer lies in the cross currency, EUR/GBP!
EUR/GBP has been getting slammed all day, which means the Euro is heading lower while the Pound is going higher. The cross currency is currently down nearly -.60% at .8685 (down 50 pips on the day). The pair formed a flag pattern on a daily timeframe during the month of September and halted its selloff from the break lower towards the flag target at .8488. The pair has been forming a symmetrical triangle since mid-October between .8580 and .8700 and is currently trading near the apex.
Source: Tradingview, FOREX.com
On a 240-minute chart the symmetrical is clearer, and it looks as if EUR/GBP is trying to push through the lower trendline of the triangle. If this is the case, the target is close to .8400 (whereas the target from the flag on the daily is .8488.)
Source: Tradingview, FOREX.com
Looking at the daily chart, there isn’t any support until the daily flag target, which is also lows from March and May, near .8475/.8500. To find support below there, we need to look at a weekly chart. The 38.2% retracement level from the lows of July 2015 to the highs in August 2019 is .8400 (which is also the target of the triangle on the 240-minute chart. Below there, horizontal support comes across at .8308.
Source: Tradingview, FOREX.com
If EUR/GBP does manage to hold within the triangle and bounce, resistance would be at the top, downward sloping trendline from the triangle near .8640. Above that, there is horizontal resistance at .8715.
Brexit headlines are usually key for movements in EUR/GBP. However, with campaigning for elections ongoing, headlines may be sparse for a while, which may keep GBP/USD steady. As we see today though, movement may come via EUR/USD and China headlines!



The complete CFD trading experience
Award-winning platforms, competitive spreads, low commissions and dedicated support.
We live and breathe the markets and are dedicated to helping traders realise their ambitions as we continue to set the industry bar.
Economic calendar
Web Trader platform
Our sophisticated web-based platform is packed with features.
Related articles
EUR/USD forecast: Eurozone stagflation risks mount as dollar holds firm ahead of data
The dollar was bouncing back at the time of writing, after it had eased overnight on the back of some weaker-than-expected economic data yesterday which had prompted markets to scale back expectations of an October Fed rate hike. However, with more significant US data due today and Friday, and with oil prices continuing to remain elevated, the dollar’s broader direction remains bullish.

NZD/USD pressure mounts as payrolls looms large
NZD/USD has fallen sharply as Fed rate expectations reset higher, but extreme downside stretch and major support raise the risk of a violent counter-trend rebound.


US Core PCE Preview: Stale or Significant for the Fed
Core PCE inflation takes center stage Wednesday, with traders watching for signs of renewed price pressure and clues on whether the Fed could hike again in October.

StoneX Europe Ltd may make third party material available on this website which may contain information included but not limited to the conditions of financial markets. The material is for information purposes only and does not contain, and should not be construed as containing, investment advice and/or investment recommendation and/or an investment research and/or an offer of or solicitation for any transactions in financial instruments; any decision to enter into a specific transaction shall be made by the client following an assessment by him/her of their situation.
StoneX Europe Ltd makes no representation or warranty and assumes no liability as to the accuracy or completeness of the information provided, nor any loss arising from any investment based on a recommendation, forecast or other information supplied. You should always seek independent advice as to your suitability to speculate in any related markets and your ability to assume the associated risks, if you are at all unsure. We are not under any obligation to update any such material. Any opinion made may be personal to the author and may not reflect the opinion of StoneX Europe Ltd.