



Gold Outlook: $5,200 becomes the battlefield for control
Gold remains stuck in a tight range with macro drivers offering few directional clues. For now, $5,200 continues to cap rallies.
Share this:

- Gold trapped in range with $5,200 capping rallies
- $5,140 and $5,075 emerge as nearby downside levels
- Break and close above $5,200 targets $5,250
Gold struggles to find a clear macro driver
Gold has spent the past week going nowhere fast, trapped in a tight range as traders struggle to pin down a clear fundamental driver.
From a macro perspective, the price action following the outbreak of war with Iran was instructive. When markets first had the opportunity to react last Monday, bullion was smashed lower alongside a host of other assets. Rather than acting as a traditional safe haven, gold initially traded like a source of liquidity.
One explanation is that it simply became a casualty of losses elsewhere. With volatility spiking across asset classes, some investors may have been forced to liquidate profitable gold positions to cover losses or meet margin calls in other markets.
What makes the move notable is what happened next. After the initial liquidation last Monday, gold has spent much of the period since chopping around within a broad range. Bearish reversals during that period were typically sharper than rallies, with the latter often grinding higher rather than surging. It feels like bears are marginally in the ascendency.
That observation is also consistent with what correlations have shown over the past week. Gold has shown little consistent relationship with traditional drivers such as the US dollar or US Treasury yields, including real yields, nor broader risk sentiment, reflecting the momentum-driven nature the metal has taken on in recent months, something frequently seen in retail-dominated markets. Instead of tracking any of these influences closely, bullion has drifted sideways.
That lack of an obvious macro anchor may explain the choppy price action we’ve seen.
$5,200 the key hurdle for bulls
Source: TradingView
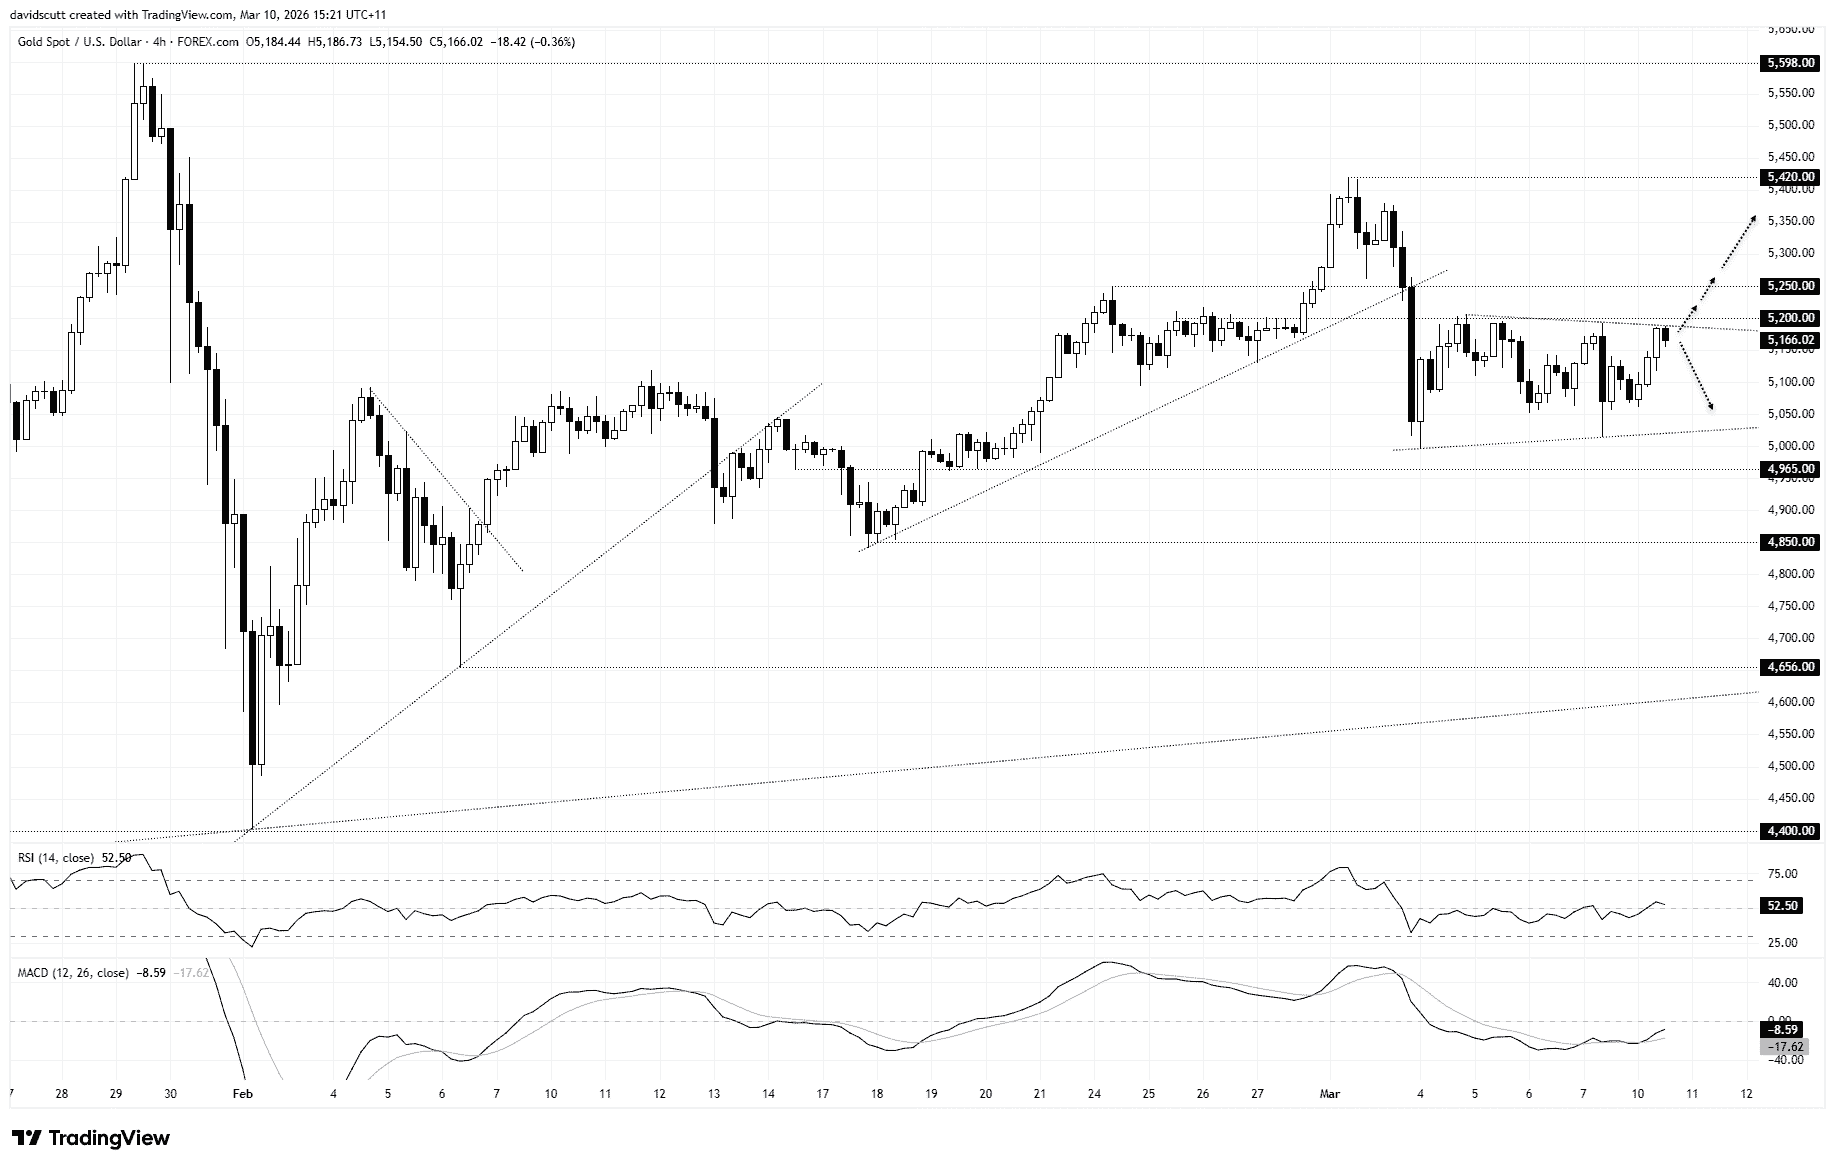
Technically, the chart reflects indecision. Gold has repeatedly tried and failed to establish a foothold above $5,200, with each attempt quickly knocked back. While there are signs of a light coiling structure taking shape since early March, marked by gradually lower highs and slightly higher lows, the limited number of touches on both trend lines suggests the pattern is not yet well defined. For now, horizontal resistance around $5,200 remains the more important feature.
Momentum indicators offer little guidance on directional risks, either. RSI (14) and MACD are hovering around neutral territory, although the gradual grind higher in both suggests immediate downside risks may be easing slightly.
From a trading perspective, the levels are clear. Continued failure near $5,200 may encourage shorts, allowing for stops to be placed above the level for protection against reversal. On the downside, $5,140 has seen frequent interaction throughout March and stands out as a nearby level of interest, followed by $5,075 and the March uptrend currently located around $5,020.
For bulls, the trigger remains a break and close above $5,200. Such a move would break the sequence of failed breakout attempts above the level, allowing for longs to be set above with a stop below for protection. On the topside, $5,250 screens as the initial target, offering a level where traders can assess whether to cut, hold, or potentially reverse positions. A sustained move through there may embolden bulls to look for a retest of the March high at $5,420.


The complete CFD trading experience
Award-winning platforms, competitive spreads, low commissions and dedicated support.
We live and breathe the markets and are dedicated to helping traders realise their ambitions as we continue to set the industry bar.
Economic calendar
Web Trader platform
Our sophisticated web-based platform is packed with features.
Related articles
EUR/USD, GBP/USD Outlook: RSI Hits 2020 Oversold Levels
EUR/USD, GBP/USD Outlook: The EUR/USD daily RSI has fallen to oversold levels last seen in 2020, raising the risk of a reversal across correlated currency pairs, including the US dollar and GBP/USD.

Dow Jones forecast: Stock markets under pressure from multiple sources
When looking at the major tech-heavy US indices like the S&P 500 or the Nasdaq 100, you wouldn’t think that the stock market is particularly weak. Yet, beneath the surface, the market is far from healthy right now. Investors are evidently just piling into the big tech and AI names, and as a result, market breadth is deteriorating. Other indices like the small cap Russell 2000 and the Dow Jones are starting to reflect that weakness.


Nikkei breakout accelerates as yen weakness returns
Nikkei has started October with a powerful breakout, helped by renewed yen weakness and strong upside momentum
StoneX Europe Ltd may make third party material available on this website which may contain information included but not limited to the conditions of financial markets. The material is for information purposes only and does not contain, and should not be construed as containing, investment advice and/or investment recommendation and/or an investment research and/or an offer of or solicitation for any transactions in financial instruments; any decision to enter into a specific transaction shall be made by the client following an assessment by him/her of their situation.
StoneX Europe Ltd makes no representation or warranty and assumes no liability as to the accuracy or completeness of the information provided, nor any loss arising from any investment based on a recommendation, forecast or other information supplied. You should always seek independent advice as to your suitability to speculate in any related markets and your ability to assume the associated risks, if you are at all unsure. We are not under any obligation to update any such material. Any opinion made may be personal to the author and may not reflect the opinion of StoneX Europe Ltd.