



Gold Vs SilverOilDowBarrick
Spot Gold price has been resilient since touching a low of $1451 an ounce in March. We are going to compare Gold with other assets on a long-term horizon...
Share this:

Spot Gold price has been resilient since touching a low of $1451 an ounce in March. We are going to compare Gold with other assets on a Long-Term Horizon.
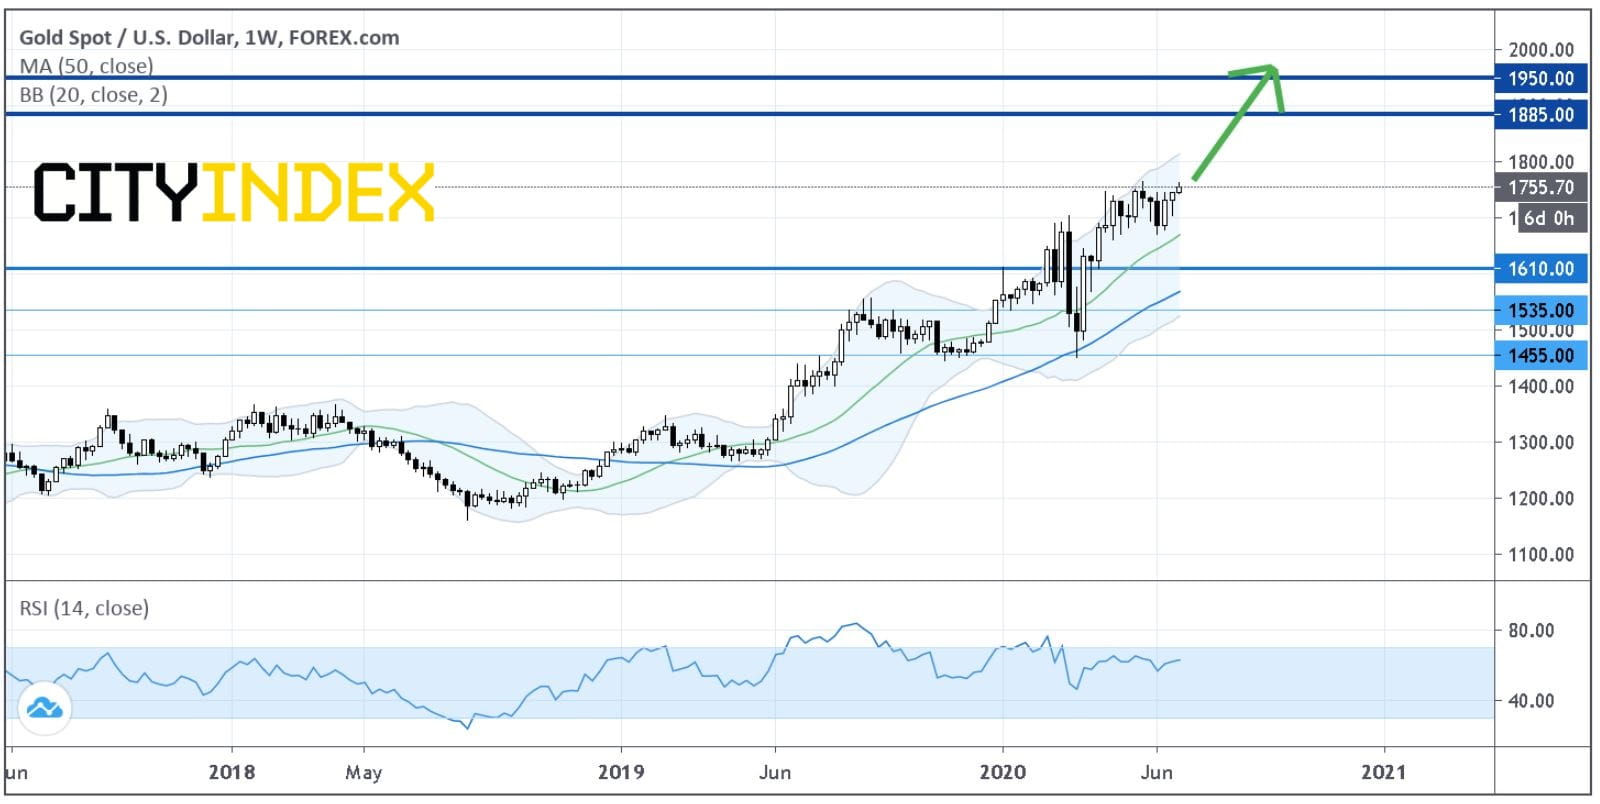
On a Weekly Chart, Spot Gold keeps trading above the ascending 20-week moving average.
Technical indicators, including 20-week, 50-week moving averages and relative strength index, are so well directed as to maintain long-term bullishness for the yellow metal.
Source: GAIN Capital, TradingView
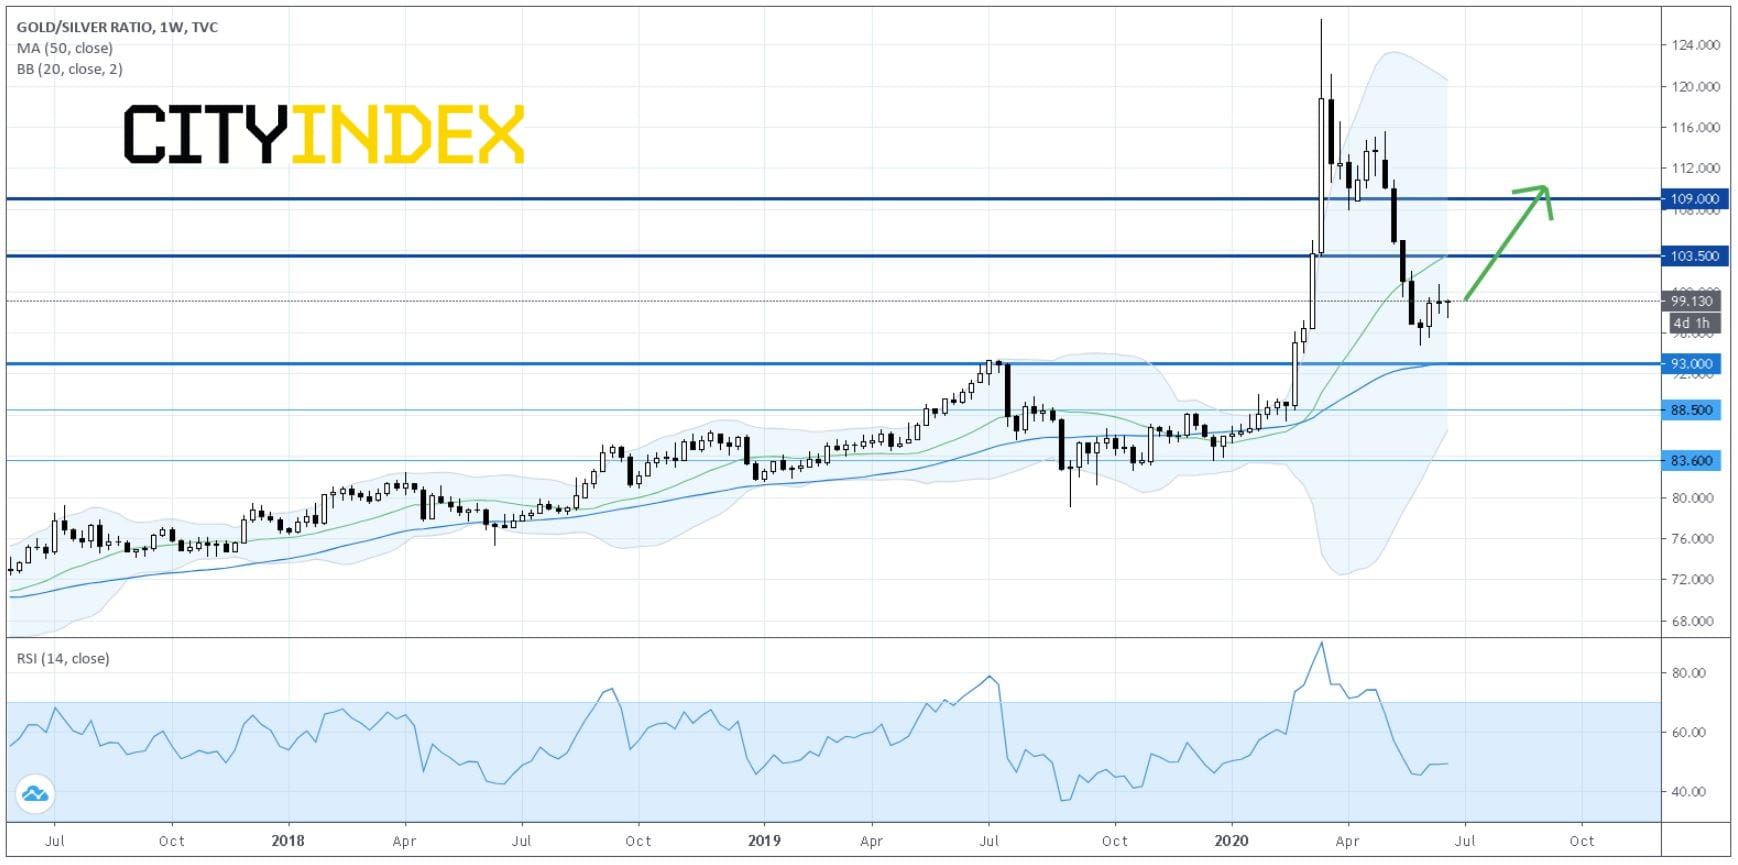
Now, let's look at the popular Gold-Silver Ratio. Effectively, the Gold-Silver Ratio represents the number of ounces of Silver that could be bought by a single ounce of Gold.
On a Weekly Chart, the Gold-Silver Ratio is rebounding from a recent low at 94.85 seen earlier in June.
In case investors agree to a bullish bias in the Gold-Silver Ratio, they should expect one ounce of Gold to be able to buy increasing ounces of Silver going forward. Their corresponding trade (now) would therefore be exchanging (or selling) silver for more ounces of gold.
Source: GAIN Capital, TradingView
In fact, over a 3-year period (from June 2017), Gold (+37.26%) has been outperforming Silver (+0.88%), and the trend seems not to change readily.

Source: GAIN Capital, TradingView
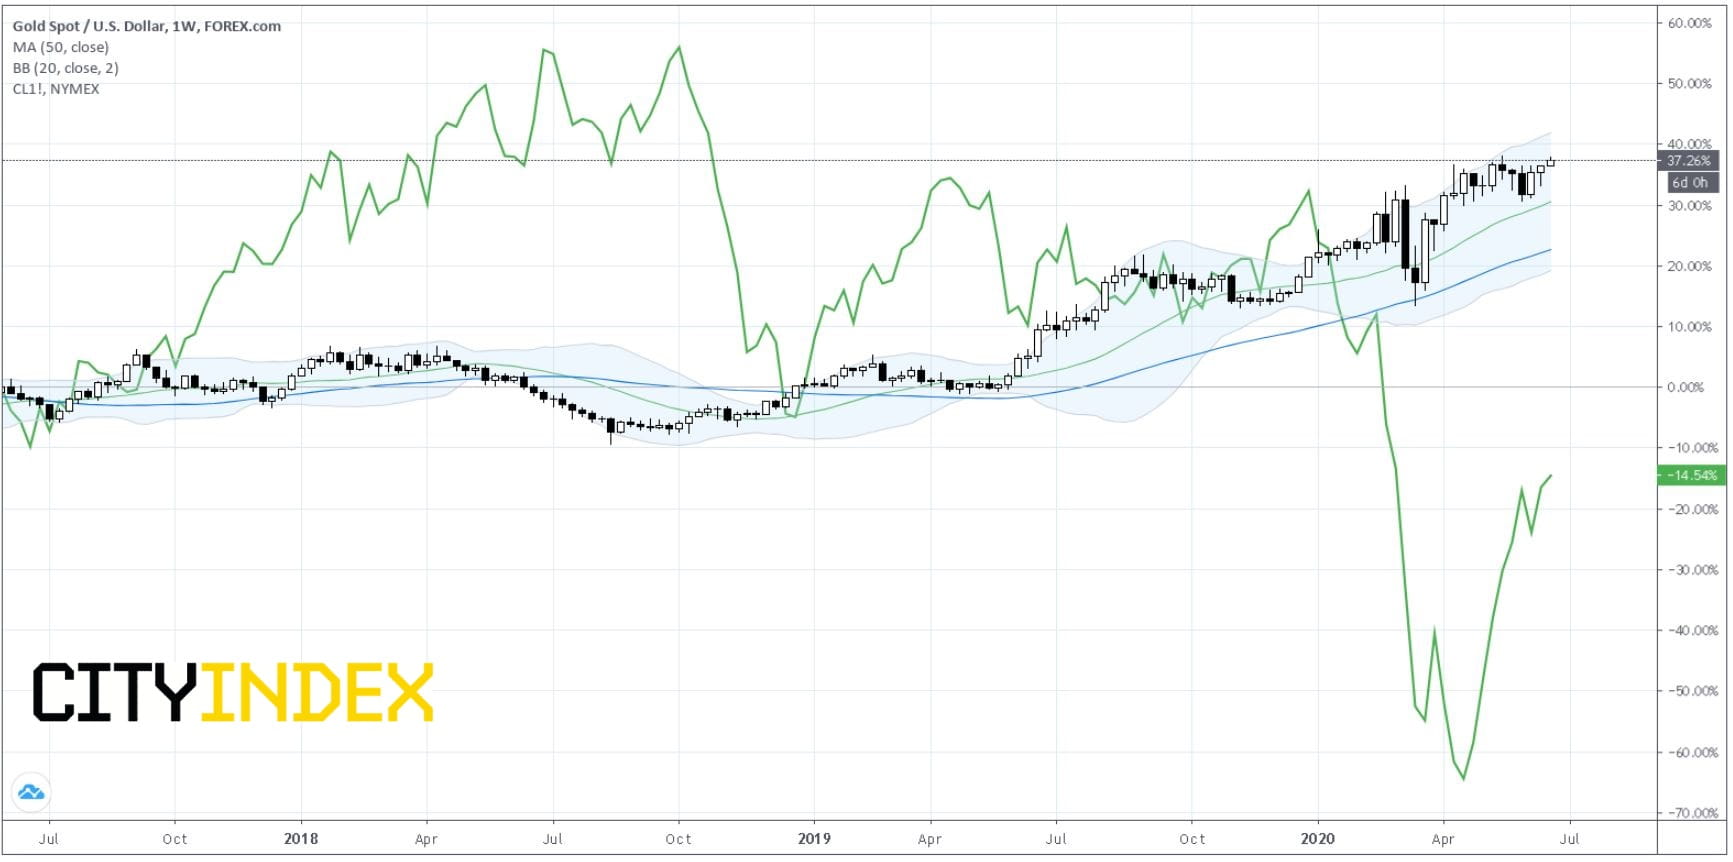
As compared to Crude Oil (-14.54%), Gold (+37.26%) excels in its power of generating stable growth.
Source: GAIN Capital, TradingView
How is Gold compared to the general U.S. stock market?
For the most part of the three years under review, the U.S. Dow Jones Industrial Average outperformed Gold...until the severe impacts of the coronavirus pandemic showed up in the later part of February.
Though we can see that the general stock market's 3-year performance (+22.72%) is currently catching up with Gold's (+37.26%), Gold really shone as a safe-haven asset during the market distress in February-March.

Source: GAIN Capital, TradingView
However, when compared with Barrick Gold Corp (NYSE: GOLD), a gold miner stock, Gold become lacklustre.
Barrick has been out-performing Gold only after rebounding from the March low. Investors must have bought the gold miner stock in anticipation of rallying gold prices.
Currently the stock has entered a consolidation period, but still it fares better than Gold on a 3-year horizon (+57.10% vs +37.26%).
S&P Global Ratings has just raised its outlook on Barrick to "Positive" from "Stable", citing the Company's "materially strengthened" balance sheet.
Barrick is the only asset under our review today that can beat Gold!.

Source: GAIN Capital, TradingView
On a Weekly Chart, Spot Gold keeps trading above the ascending 20-week moving average.
Technical indicators, including 20-week, 50-week moving averages and relative strength index, are so well directed as to maintain long-term bullishness for the yellow metal.
A continued rally should let Gold price encounter Upside Resistance at $1885 and $1950 (61.80% Fibonacci extrapolation from March low).
Long-term Key Support is located at $1610.
Spot Gold: Weekly Chart
Source: GAIN Capital, TradingView
Now, let's look at the popular Gold-Silver Ratio. Effectively, the Gold-Silver Ratio represents the number of ounces of Silver that could be bought by a single ounce of Gold.
On a Weekly Chart, the Gold-Silver Ratio is rebounding from a recent low at 94.85 seen earlier in June.
In case investors agree to a bullish bias in the Gold-Silver Ratio, they should expect one ounce of Gold to be able to buy increasing ounces of Silver going forward. Their corresponding trade (now) would therefore be exchanging (or selling) silver for more ounces of gold.
Gold-Silver Ratio: Weekly Chart
Source: GAIN Capital, TradingView
In fact, over a 3-year period (from June 2017), Gold (+37.26%) has been outperforming Silver (+0.88%), and the trend seems not to change readily.
Gold vs Silver: Performance Chart
Source: GAIN Capital, TradingView
Crude Oil price, during a 3-year period, has seen higher volatility than Gold.
Still remember Crude Oil futures prices sank into negative territory in April?
As compared to Crude Oil (-14.54%), Gold (+37.26%) excels in its power of generating stable growth.
Gold vs Crude Oil: Performance Chart
Source: GAIN Capital, TradingView
How is Gold compared to the general U.S. stock market?
For the most part of the three years under review, the U.S. Dow Jones Industrial Average outperformed Gold...until the severe impacts of the coronavirus pandemic showed up in the later part of February.
Though we can see that the general stock market's 3-year performance (+22.72%) is currently catching up with Gold's (+37.26%), Gold really shone as a safe-haven asset during the market distress in February-March.
Gold vs Dow Jones Industrial Average: Performance Chart
Source: GAIN Capital, TradingView
However, when compared with Barrick Gold Corp (NYSE: GOLD), a gold miner stock, Gold become lacklustre.
Barrick has been out-performing Gold only after rebounding from the March low. Investors must have bought the gold miner stock in anticipation of rallying gold prices.
Currently the stock has entered a consolidation period, but still it fares better than Gold on a 3-year horizon (+57.10% vs +37.26%).
S&P Global Ratings has just raised its outlook on Barrick to "Positive" from "Stable", citing the Company's "materially strengthened" balance sheet.
Barrick is the only asset under our review today that can beat Gold!.
Gold vs Barrick Gold Corp: Performance Chart
Source: GAIN Capital, TradingView
Spot Gold price has been resilient since touching a low of $1451 an ounce in March. We are going to compare Gold with other assets on a Long-Term Horizon.
On a Weekly Chart, Spot Gold keeps trading above the ascending 20-week moving average.
Technical indicators, including 20-week, 50-week moving averages and relative strength index, are so well directed as to maintain long-term bullishness for the yellow metal.

Source: GAIN Capital, TradingView
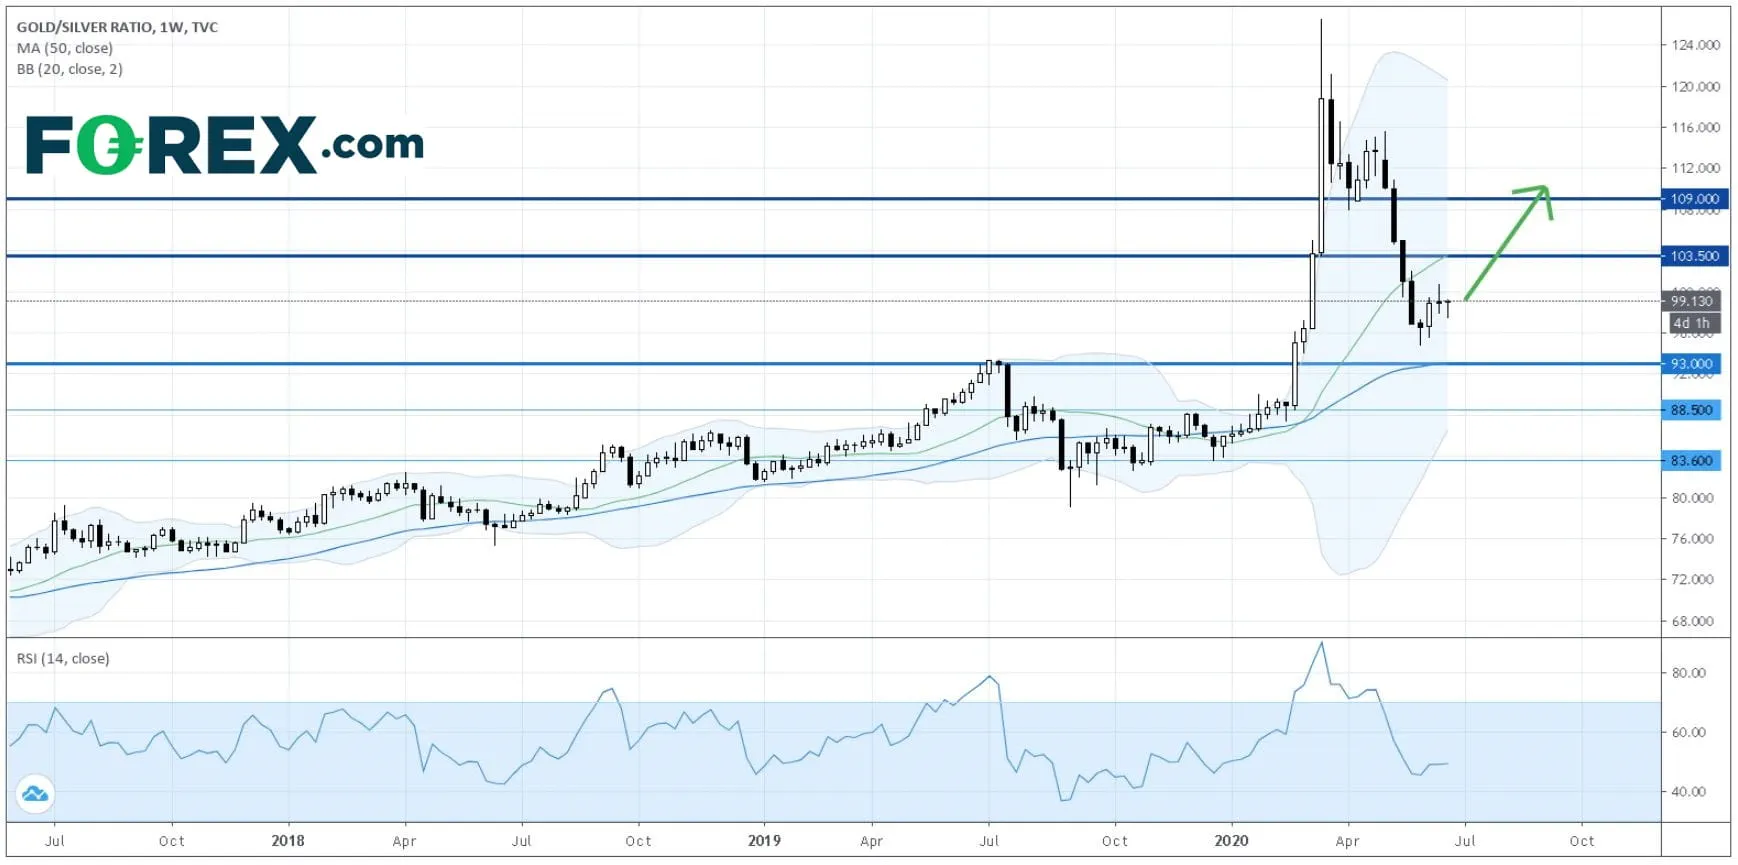
Now, let's look at the popular Gold-Silver Ratio. Effectively, the Gold-Silver Ratio represents the number of ounces of Silver that could be bought by a single ounce of Gold.
On a Weekly Chart, the Gold-Silver Ratio is rebounding from a recent low at 94.85 seen earlier in June.
In case investors agree to a bullish bias in the Gold-Silver Ratio, they should expect one ounce of Gold to be able to buy increasing ounces of Silver going forward. Their corresponding trade (now) would therefore be exchanging (or selling) silver for more ounces of gold.
Source: GAIN Capital, TradingView
In fact, over a 3-year period (from June 2017), Gold (+37.26%) has been outperforming Silver (+0.88%), and the trend seems not to change readily.

Source: GAIN Capital, TradingView
As compared to Crude Oil (-14.54%), Gold (+37.26%) excels in its power of generating stable growth.

Source: GAIN Capital, TradingView
How is Gold compared to the general U.S. stock market?
For the most part of the three years under review, the U.S. Dow Jones Industrial Average outperformed Gold...until the severe impacts of the coronavirus pandemic showed up in the later part of February.
Though we can see that the general stock market's 3-year performance (+22.72%) is currently catching up with Gold's (+37.26%), Gold really shone as a safe-haven asset during the market distress in February-March.

Source: GAIN Capital, TradingView
However, when compared with Barrick Gold Corp (NYSE: GOLD), a gold miner stock, Gold become lacklustre.
Barrick has been out-performing Gold only after rebounding from the March low. Investors must have bought the gold miner stock in anticipation of rallying gold prices.
Currently the stock has entered a consolidation period, but still it fares better than Gold on a 3-year horizon (+57.10% vs +37.26%).
S&P Global Ratings has just raised its outlook on Barrick to "Positive" from "Stable", citing the Company's "materially strengthened" balance sheet.
Barrick is the only asset under our review today that can beat Gold!.

Source: GAIN Capital, TradingView
On a Weekly Chart, Spot Gold keeps trading above the ascending 20-week moving average.
Technical indicators, including 20-week, 50-week moving averages and relative strength index, are so well directed as to maintain long-term bullishness for the yellow metal.
A continued rally should let Gold price encounter Upside Resistance at $1885 and $1950 (61.80% Fibonacci extrapolation from March low).
Long-term Key Support is located at $1610.
Spot Gold: Weekly Chart
Source: GAIN Capital, TradingView
Now, let's look at the popular Gold-Silver Ratio. Effectively, the Gold-Silver Ratio represents the number of ounces of Silver that could be bought by a single ounce of Gold.
On a Weekly Chart, the Gold-Silver Ratio is rebounding from a recent low at 94.85 seen earlier in June.
In case investors agree to a bullish bias in the Gold-Silver Ratio, they should expect one ounce of Gold to be able to buy increasing ounces of Silver going forward. Their corresponding trade (now) would therefore be exchanging (or selling) silver for more ounces of gold.
Gold-Silver Ratio: Weekly Chart
Source: GAIN Capital, TradingView
In fact, over a 3-year period (from June 2017), Gold (+37.26%) has been outperforming Silver (+0.88%), and the trend seems not to change readily.
Gold vs Silver: Performance Chart
Source: GAIN Capital, TradingView
Crude Oil price, during a 3-year period, has seen higher volatility than Gold.
Still remember Crude Oil futures prices sank into negative territory in April?
As compared to Crude Oil (-14.54%), Gold (+37.26%) excels in its power of generating stable growth.
Gold vs Crude Oil: Performance Chart
Source: GAIN Capital, TradingView
How is Gold compared to the general U.S. stock market?
For the most part of the three years under review, the U.S. Dow Jones Industrial Average outperformed Gold...until the severe impacts of the coronavirus pandemic showed up in the later part of February.
Though we can see that the general stock market's 3-year performance (+22.72%) is currently catching up with Gold's (+37.26%), Gold really shone as a safe-haven asset during the market distress in February-March.
Gold vs Dow Jones Industrial Average: Performance Chart
Source: GAIN Capital, TradingView
However, when compared with Barrick Gold Corp (NYSE: GOLD), a gold miner stock, Gold become lacklustre.
Barrick has been out-performing Gold only after rebounding from the March low. Investors must have bought the gold miner stock in anticipation of rallying gold prices.
Currently the stock has entered a consolidation period, but still it fares better than Gold on a 3-year horizon (+57.10% vs +37.26%).
S&P Global Ratings has just raised its outlook on Barrick to "Positive" from "Stable", citing the Company's "materially strengthened" balance sheet.
Barrick is the only asset under our review today that can beat Gold!.
Gold vs Barrick Gold Corp: Performance Chart
Source: GAIN Capital, TradingView
Related tags:
Latest market news




The complete CFD trading experience
Award-winning platforms, competitive spreads, low commissions and dedicated support.
We live and breathe the markets and are dedicated to helping traders realise their ambitions as we continue to set the industry bar.
Economic calendar
Web Trader platform
Our sophisticated web-based platform is packed with features.
Related articles
Gold Q4 2026 outlook: Resilience in the face of rallying dollar and yields
As we headed towards the latter stages of Q3 and into Q4, the Fed had just hiked rates in a hawkish FOMC meeting, while the likes of the ECB and BoJ had also tightened their respective policies. Oil prices remained elevated amid the prolonged US-Iran conflict. Meanwhile, bond yields were breaking out, and the dollar was higher across the board. Yet, remarkably, gold was still holding in the positive territory for the third quarter, even if it had weakened somewhat in September.

Gold forecast: XAU/USD could take a larger dive after the big rise in yields
Gold prices have been falling in the last few days after last week’s post-FOMC pop faded amid rising interest rate expectations, higher oil prices and a strengthening US dollar. As before, I wasn’t convinced gold would thrive in the current macro backdrop.

Gold, silver slammed as hawkish Fed repricing reignites dollar upside
Gold and silver had held up surprisingly well against surging US yields. Wednesday’s DXY breakout may have changed that equation.

StoneX Europe Ltd may make third party material available on this website which may contain information included but not limited to the conditions of financial markets. The material is for information purposes only and does not contain, and should not be construed as containing, investment advice and/or investment recommendation and/or an investment research and/or an offer of or solicitation for any transactions in financial instruments; any decision to enter into a specific transaction shall be made by the client following an assessment by him/her of their situation.
StoneX Europe Ltd makes no representation or warranty and assumes no liability as to the accuracy or completeness of the information provided, nor any loss arising from any investment based on a recommendation, forecast or other information supplied. You should always seek independent advice as to your suitability to speculate in any related markets and your ability to assume the associated risks, if you are at all unsure. We are not under any obligation to update any such material. Any opinion made may be personal to the author and may not reflect the opinion of StoneX Europe Ltd.