



Gold Wrap: 1700 gives way, but key support awaits
Momentum is clearly pointing lower for gold, but we’re keeping an eye on the monthly charts as we head into August due to a potential level of support.
Share this:

Gold has fallen below $1700 for the first time since August, and has continued lower today. We’re likely seeing a secondary reaction to the fact that gold fell below $1700 – a key level some had assumed would hold longer than it did.
It’s difficult to see how much support safe-haven flows have provided gold in context of its strong downtrend of late. But we could assume that gold could be trading lower, were it not for geopolitical tension brewing in the background.


We can see on the daily chart it broke out of an descending triangle and reached target overnight, and has since broken blow its 200-weel eMA. Being such a long-term level we can expect some volatility around it, but such levels do no usually break so easily. Still, the 10 and 20-bar eMA’s are capping as resistance and bears seem likely to fade into rallies.
Gold monthly chart:
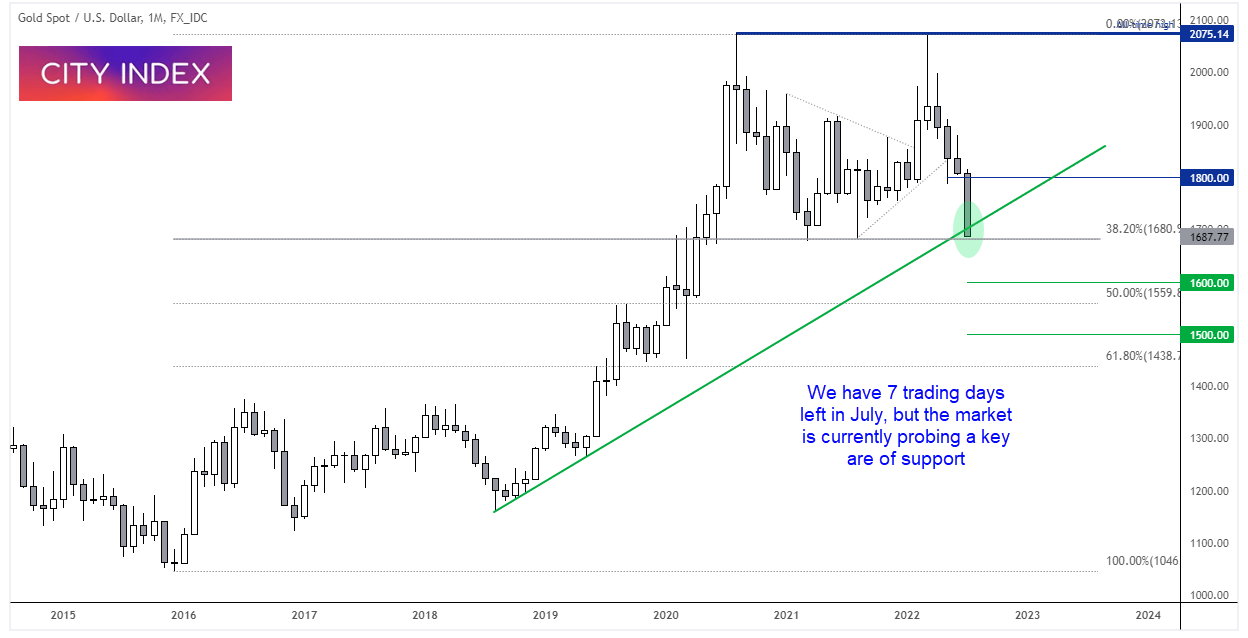
We have several trading days left this month, yet gold has already fallen -6.5% in July which currently its worst month in 13. A stronger US dollar and aggressive hikes from central bank certainly taken their toll on the yellow metal. Assuming it finishes the month lower – which appears likely – it will be the fifth month this year to do so, which would be the worst start to the year since 2013.
Looking at it from that metric, I’m in no rush to call a low on this market. However, prices are approaching a technical juncture around 1687 which could prompt some volatility around it as we head into August.

The monthly chart is trading just below the 2018 trendline, and just above the 2021 (pandemic) lows. Note that they also coincide with the 38.2% Fibonacci ratio between the 2022 high and 2016 low. So which side July closes on could dictate the sentiment for August, and be the difference between a admirable bounce of continued selloff.
But I’d wager a bet there are large stops beneath those 2021 lows, and if they get triggered it could be time to buckle up, as $1600 is within easy reach for bears looking at current levels of volatility.
To see a material turnaround and subsequent gold rally, I suspect we need to see hard evidence that inflation has topped and that the phase of central bank tightening is over. And I don’t think we’re quite there yet.
How to trade with City Index
You can easily trade with City Index by using these four easy steps:
- Open an account, or log in if you’re already a customer
• Open an account in the UK
• Open an account in Australia
• Open an account in Singapore
- Search for the company you want to trade in our award-winning platform
- Choose your position and size, and your stop and limit levels
- Place the trade
How to trade with FOREX.com
Follow these easy steps to start trading with FOREX.com today:
- Open a Forex.com account, or log in if you’re already a customer.
- Search for the pair you want to trade in our award-winning platform.
- Choose your position and size, and your stop and limit levels.
- Place the trade.
Related tags:



The complete CFD trading experience
Award-winning platforms, competitive spreads, low commissions and dedicated support.
We live and breathe the markets and are dedicated to helping traders realise their ambitions as we continue to set the industry bar.
Economic calendar
Web Trader platform
Our sophisticated web-based platform is packed with features.
Related articles
Gold forecast: Rising yields become too hot for gold, but the outlook is far from bearish
Gold and silver prices took a plunge today, with the former down 3% and the latter falling some 5% by mid European session, before bouncing off their lows. The losses come after the metals remained largely supported until last week, despite the big dollar rally and surging bond yields as we have seen in recent weeks. But it simply got too much, and the metals succumbed to pressure today.

AUD/USD forecast: Currency Pair of the Week | September 28, 2026
The week has started with stocks, gold, silver and bitcoin all falling, as crude oil rebounded and bond yields pushed further higher. Trump refusing to agree to Tehran’s proposal to re-open the Strait of Hormuz has left the markets disappointed. Still, reports that mediators are expected to hold talks with the two sides on an amended version of the 7-day proposal that Iran presented, keeps hopes alive that we may see some progress.

Gold Dips Below Three-Month Uptrend, Bitcoin Pulls Back from Nine-Month High
Gold has dipped below its three-month uptrend, while Bitcoin has pulled back from a nine-month high as U.S. bond yields test levels last seen in 2004 and 2007. Risks build as Fed rate-hike expectations remain above 70%, while the Dollar Index holds near yearly highs.

StoneX Europe Ltd may make third party material available on this website which may contain information included but not limited to the conditions of financial markets. The material is for information purposes only and does not contain, and should not be construed as containing, investment advice and/or investment recommendation and/or an investment research and/or an offer of or solicitation for any transactions in financial instruments; any decision to enter into a specific transaction shall be made by the client following an assessment by him/her of their situation.
StoneX Europe Ltd makes no representation or warranty and assumes no liability as to the accuracy or completeness of the information provided, nor any loss arising from any investment based on a recommendation, forecast or other information supplied. You should always seek independent advice as to your suitability to speculate in any related markets and your ability to assume the associated risks, if you are at all unsure. We are not under any obligation to update any such material. Any opinion made may be personal to the author and may not reflect the opinion of StoneX Europe Ltd.