



Index in focus: Nasdaq 100 (US Tech 100) struggles to get off the floor
Sentiment toward indices and the Nasdaq 100 in particular remains heavily tilted in favor of the bears...
Share this:

After a decade of prices going essentially straight up, Nasdaq 100 (US Tech 100) traders are now adjusting to the exact opposite scenario.
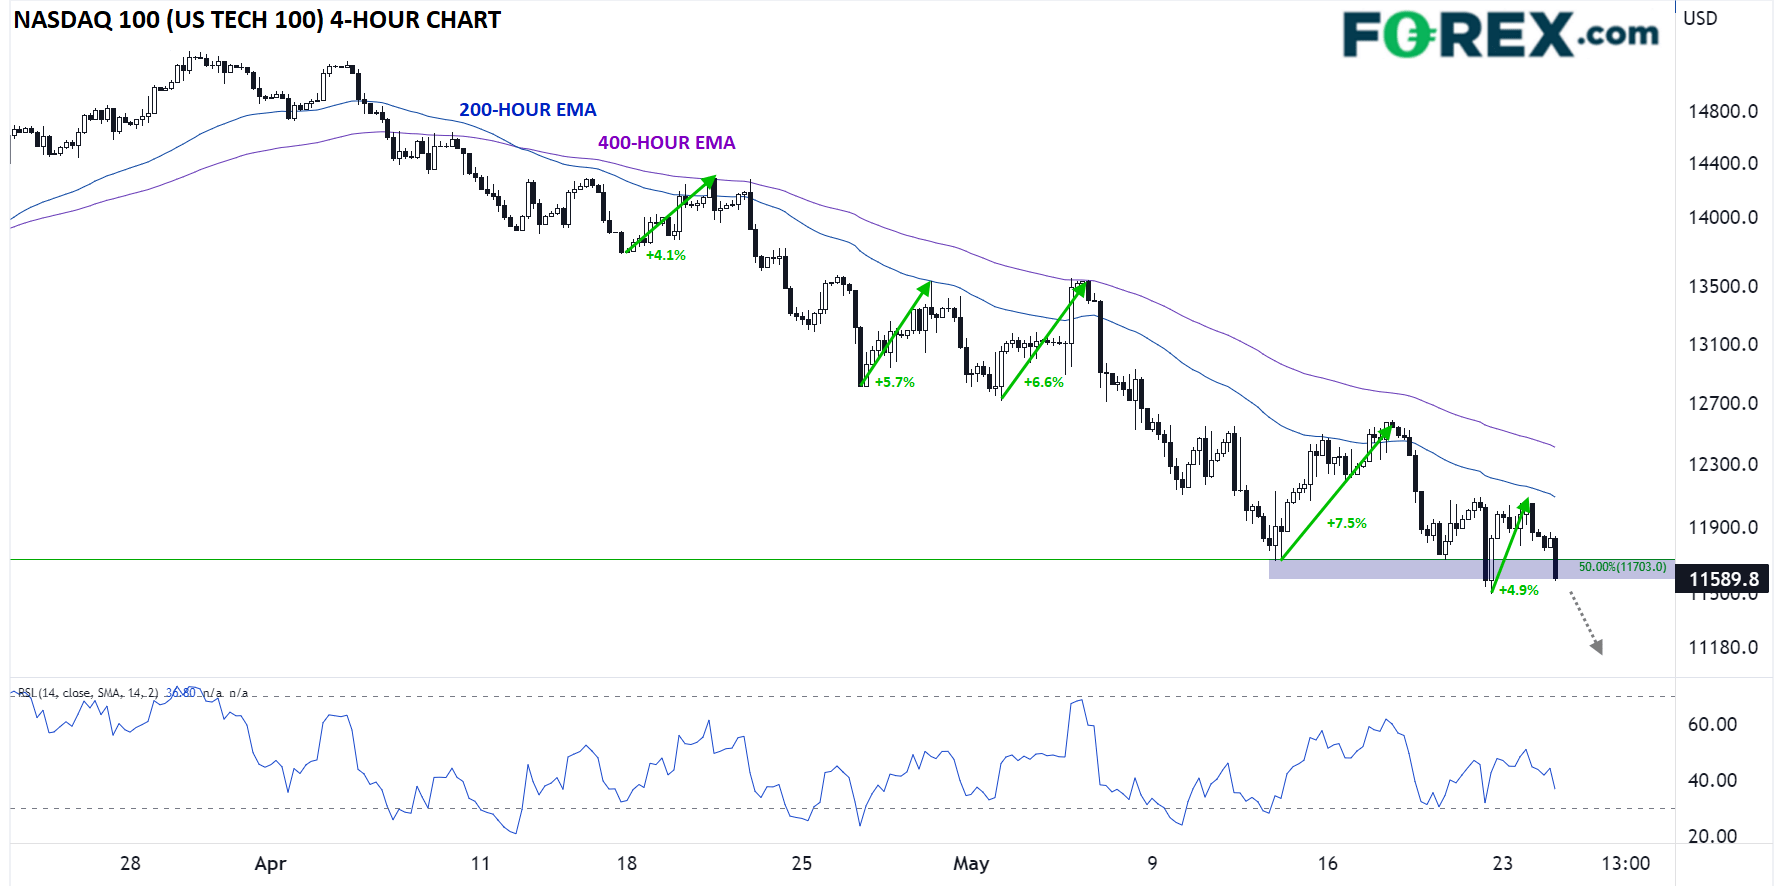
Since peaking near 15,250 in late March, the Nasdaq 100 has traded essentially straight lower for the last two months, losing nearly a quarter of its value with only small, short-lived bounces to pause the relentless selling. As the chart below shows, the index has seen just 5 countertrend rallies of 4%+, none of which lasted more than a couple days:
Source: StoneX, TradingView
Over the past 6 weeks, the 400-hour exponential moving average (100-period EMA on the 4-hour chart) has consistently put a lid on these rallies, and as of writing, the index is once again at risk of breaking down to a new low as bears set their sights on last week’s low in the 11,500 area. Below that zone, there’s little in the way of notable support until the November 2020 lows near 11,000.
From a fundamental perspective, the index has been getting hit on two sides: Not only are the valuations investors are willing to pay declining as inflation and interest rates rise, but the earnings growth for many of the mid- and large-capitalization growth names is at risk of stalling, as recent results from prominent names like Netflix (NFLX) and Cisco Systems (CSCO) demonstrate.
At the end of the day, sentiment toward indices and the Nasdaq 100 in particular remains heavily tilted in favor of the bears. With the so-called “generals” of the market – previously-unassailable mega-cap giants like Amazon (AMZN), Alphabet (GOOG), and Tesla (TSLA) – hitting new lows as we go to press, the path of least resistance remains lower. Bulls will need to see markets stabilize and the selling dissipate for more than a couple of days before even considering the prospect of the dominant downtrend ending.
How to trade with FOREX.com
Follow these easy steps to start trading with FOREX.com today:
- Open a Forex.com account, or log-in if you’re already a customer.
- Search for the pair you want to trade in our award-winning platform.
- Choose your position and size, and your stop and limit levels.
- Place the trade.
After a decade of prices going essentially straight up, Nasdaq 100 (US Tech 100) traders are now adjusting to the exact opposite scenario.
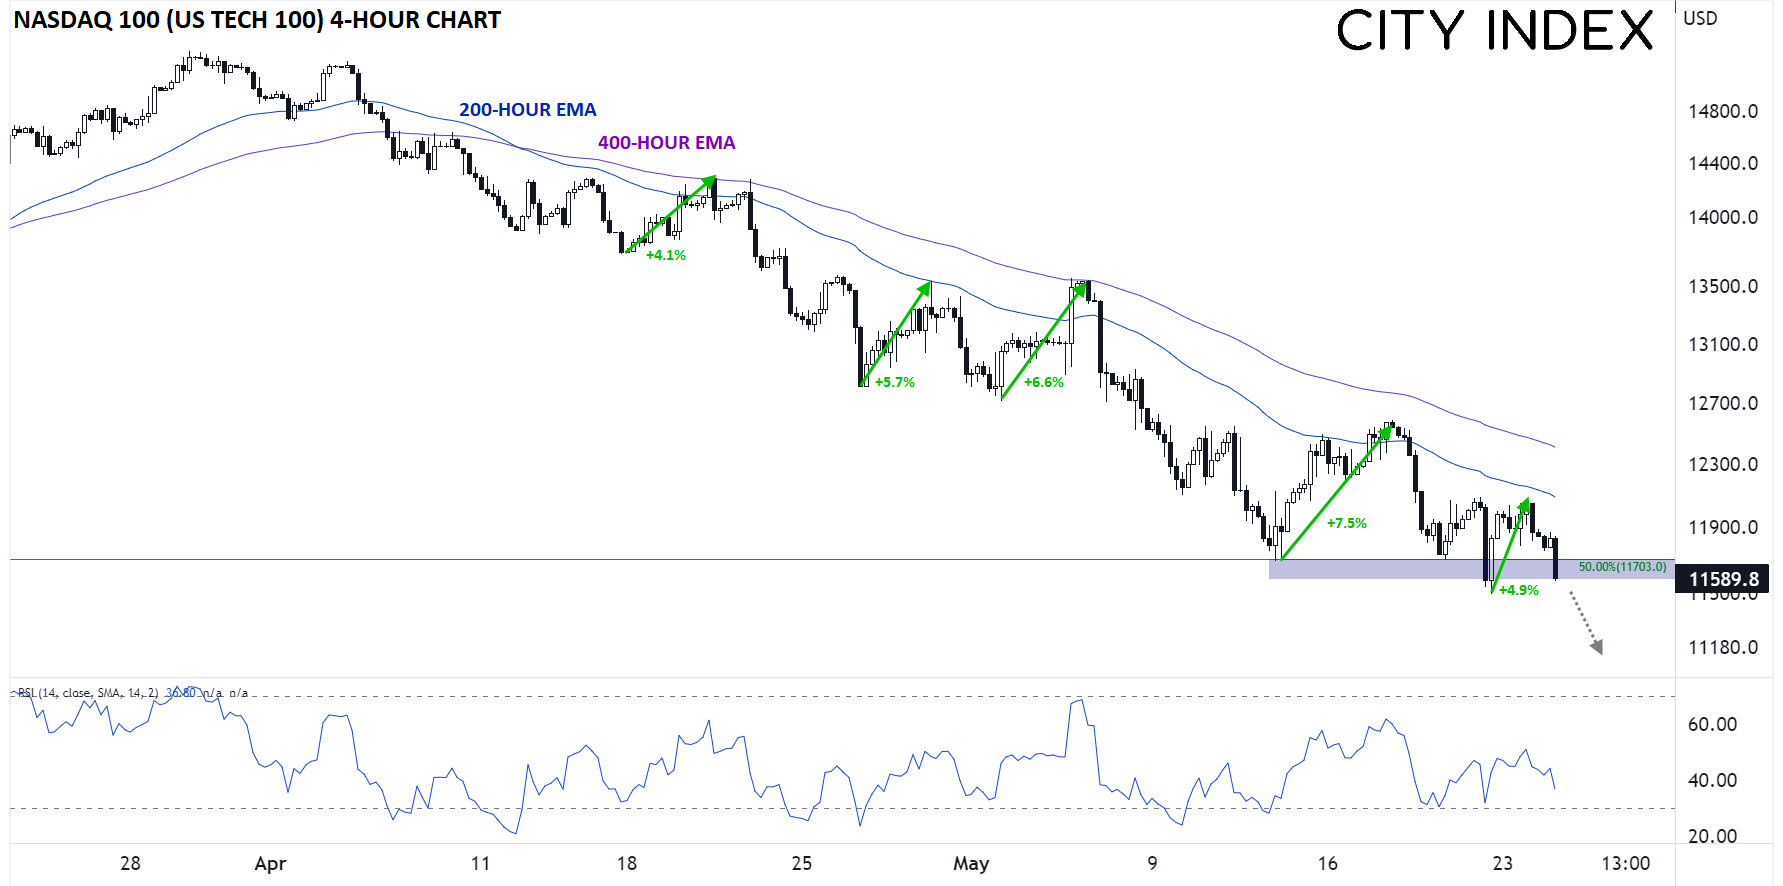
Since peaking near 15,250 in late March, the Nasdaq 100 has traded essentially straight lower for the last two months, losing nearly a quarter of its value with only small, short-lived bounces to pause the relentless selling. As the chart below shows, the index has seen just 5 countertrend rallies of 4%+, none of which lasted more than a couple days:
Source: StoneX, TradingView
Over the past 6 weeks, the 400-hour exponential moving average (100-period EMA on the 4-hour chart) has consistently put a lid on these rallies, and as of writing, the index is once again at risk of breaking down to a new low as bears set their sights on last week’s low in the 11,500 area. Below that zone, there’s little in the way of notable support until the November 2020 lows near 11,000.
From a fundamental perspective, the index has been getting hit on two sides: Not only are the valuations investors are willing to pay declining as inflation and interest rates rise, but the earnings growth for many of the mid- and large-capitalization growth names is at risk of stalling, as recent results from prominent names like Netflix (NFLX) and Cisco Systems (CSCO) demonstrate.
At the end of the day, sentiment toward indices and the Nasdaq 100 in particular remains heavily tilted in favor of the bears. With the so-called “generals” of the market – previously-unassailable mega-cap giants like Amazon (AMZN), Alphabet (GOOG), and Tesla (TSLA) – hitting new lows as we go to press, the path of least resistance remains lower. Bulls will need to see markets stabilize and the selling dissipate for more than a couple of days before even considering the prospect of the dominant downtrend ending.
How to trade with City Index
You can trade with City Index by following these four easy steps:
- Open an account, or log in if you’re already a customer
• Open an account in the UK
• Open an account in Australia
• Open an account in Singapore
- Search for the market you want to trade in our award-winning platform
- Choose your position and size, and your stop and limit levels
- Place the trade
Related tags:


The complete CFD trading experience
Award-winning platforms, competitive spreads, low commissions and dedicated support.
We live and breathe the markets and are dedicated to helping traders realise their ambitions as we continue to set the industry bar.
Economic calendar
Web Trader platform
Our sophisticated web-based platform is packed with features.
Related articles
Japanese Yen Forecast: USD/JPY 4% Rally Challenges Post-Intervention Downtrend 9 24 2026
USD/JPY momentum has shifted sharply higher, putting a major resistance confluence in focus as U.S. and Japanese event risk builds.

GBP/USD, DJIA Outlook: Support Levels Meet Oversold Risks
GBP/USD and the Dow test key support levels as rising Treasury yields, Fed rate-hike expectations and oversold momentum increase reversal risks.


USD/JPY outlook: Hawkish Fed recalibration pressures the yen
Stronger US growth momentum and rising Treasury yields are keeping USD/JPY pointed higher, even as Japanese policymakers try to limit the pressure building across domestic markets.

StoneX Europe Ltd may make third party material available on this website which may contain information included but not limited to the conditions of financial markets. The material is for information purposes only and does not contain, and should not be construed as containing, investment advice and/or investment recommendation and/or an investment research and/or an offer of or solicitation for any transactions in financial instruments; any decision to enter into a specific transaction shall be made by the client following an assessment by him/her of their situation.
StoneX Europe Ltd makes no representation or warranty and assumes no liability as to the accuracy or completeness of the information provided, nor any loss arising from any investment based on a recommendation, forecast or other information supplied. You should always seek independent advice as to your suitability to speculate in any related markets and your ability to assume the associated risks, if you are at all unsure. We are not under any obligation to update any such material. Any opinion made may be personal to the author and may not reflect the opinion of StoneX Europe Ltd.