




Limit Down and Rough Open Expected For Wall Street
The toxic combination of an oil price collapse along with escalating coronavirus fears is setting the scene for one of the wildest days in years for global markets and US indices.
Share this:

The toxic combination of an oil price collapse along with escalating coronavirus fears is setting the scene for one of the wildest days in years for global markets and US indices.
Panic selling is engulfing the markets as traders attempt to figure out how the oil price war and the rapid spread of coronavirus and the associated supply demand shock will impact the global economy.
The toxic combination of an oil price collapse along with escalating coronavirus fears is setting the scene for one of the wildest days in years for global markets and US indices.Indices in Europe have plunged sharply in the European session. The FTSE experienced losses of 8.5% at its worst and US index futures have plunged 5%, indicating a sharp fall on the open. The panic exists because traders cannot quantify either the oil price war or the coronavirus impact. Markets hate uncertainty and recession fears are growing, fanned further by dismal data from China
Over in the US, futures trading was suspended in the Asian session on limit down after the S&P fell 5% making for a very uncertain US open.
What is limit down or circuit breaker?
A limit down price is the maximum sell-off permitted under NYSE rules in a market on a single day of trading. Once this level has been reached, the market is then suspended to prevent significant volatility and potential panic selling. A limit down price is typically determined as a percentage decline in a given market, rather than a nominal decline in price.
A limit down price is the maximum sell-off permitted under NYSE rules in a market on a single day of trading. Once this level has been reached, the market is then suspended to prevent significant volatility and potential panic selling. A limit down price is typically determined as a percentage decline in a given market, rather than a nominal decline in price.
Circuit breakers levels
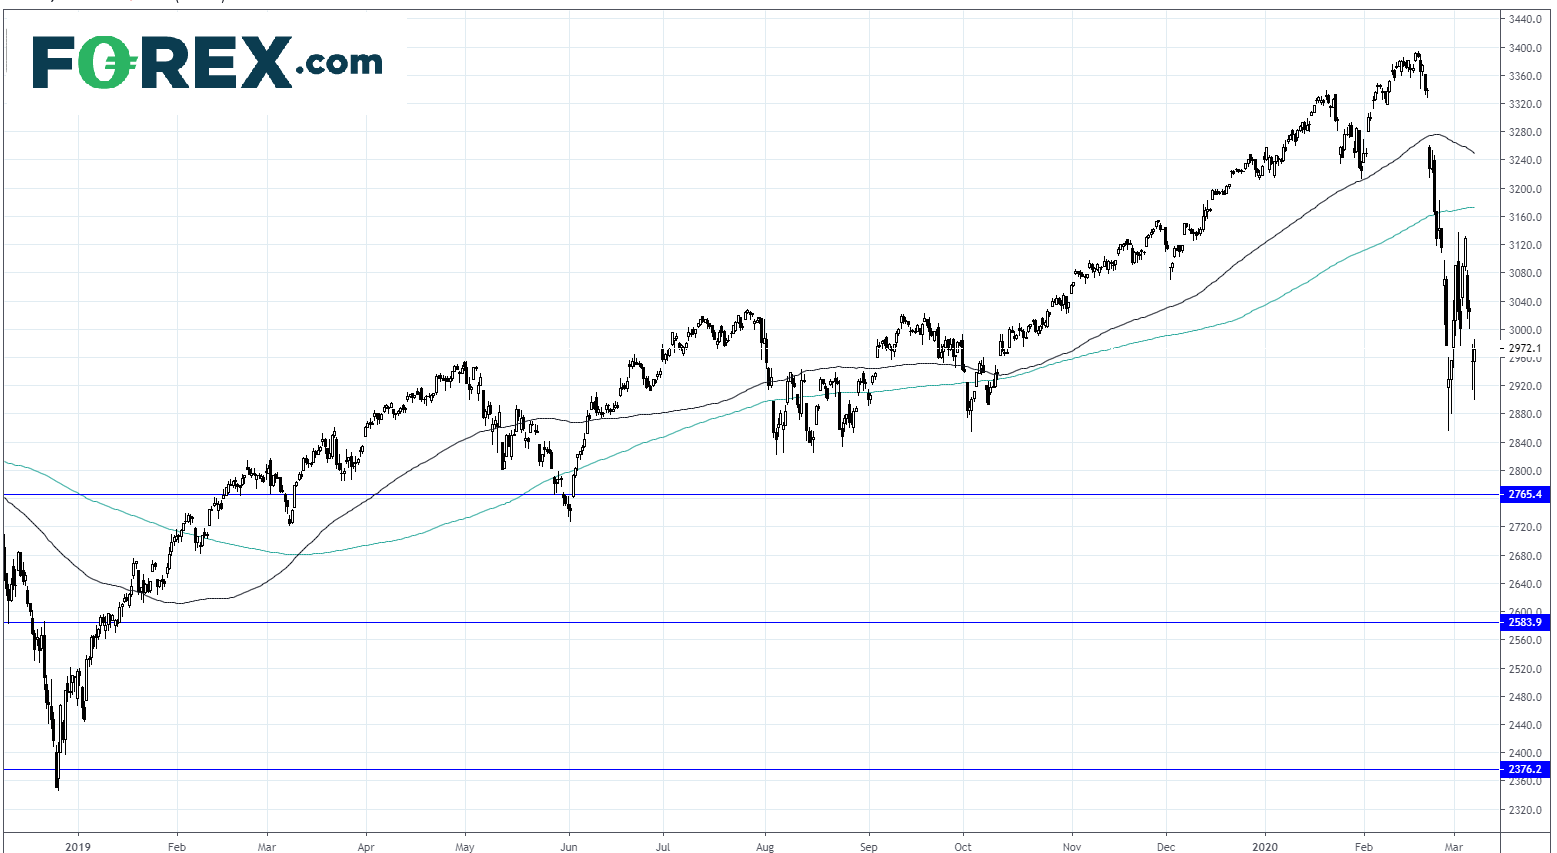
There are three circuit breaker levels, when declines in the S&P breach 7% and 13%, trading will pause for 15 minutes. A 20% decline would shut trading for the rest of the day under current NYSE trading rules.
There are three circuit breaker levels, when declines in the S&P breach 7% and 13%, trading will pause for 15 minutes. A 20% decline would shut trading for the rest of the day under current NYSE trading rules.
Not the first time
This is not the first time that the markets have experienced limit down. US equity futures trading were limit down after President Trump’s surprise 2016 election. Whilst there was significant volatility on days following the results, this actually calmed relatively quickly and saw the US stock markets rally across the following 4 year to reach an all-time high in February.
On the other hand, limit down was also experienced in the 2008 financial crash. The markets plunged as traders feared the banking crisis would lead to a global recession, which it did.
Recession coming?
The one two punch of an oil price war, coronavirus outbreak escalation, combined with dismal data from China has investors fearing a global recession. It is impossible to tell right now how this will pan out. Limit down does not in itself mean that a recession will pursue. However, the bond market is pointing to some dark days ahead.
Circuit breaker level chart S&P
Panic selling is engulfing the markets as traders attempt to figure out how the oil price war and the rapid spread of coronavirus and the associated supply demand shock will impact the global economy.
Indices in Europe have plunged sharply in the European session. The FTSE experienced losses of 8.5% at its worst and US index futures have plunged 5%, indicating a sharp fall on the open. The panic exists because traders cannot quantify either the oil price war or the coronavirus impact. Markets hate uncertainty and recession fears are growing, fanned further by dismal data from China
Over in the US, futures trading was suspended in the Asian session on limit down after the S&P fell 5% making for a very uncertain US open.
What is limit down or circuit breaker?
A limit down price is the maximum sell-off permitted under NYSE rules in a market on a single day of trading. Once this level has been reached, the market is then suspended to prevent significant volatility and potential panic selling. A limit down price is typically determined as a percentage decline in a given market, rather than a nominal decline in price.
A limit down price is the maximum sell-off permitted under NYSE rules in a market on a single day of trading. Once this level has been reached, the market is then suspended to prevent significant volatility and potential panic selling. A limit down price is typically determined as a percentage decline in a given market, rather than a nominal decline in price.
Circuit breakers levels
There are three circuit breaker levels, when declines in the S&P breach 7% and 13%, trading will pause for 15 minutes. A 20% decline would shut trading for the rest of the day under current NYSE trading rules.
There are three circuit breaker levels, when declines in the S&P breach 7% and 13%, trading will pause for 15 minutes. A 20% decline would shut trading for the rest of the day under current NYSE trading rules.
Not the first time
This is not the first time that the markets have experienced limit down. US equity futures trading were limit down after President Trump’s surprise 2016 election. Whilst there was significant volatility on days following the results, this actually calmed relatively quickly and saw the US stock markets rally across the following 4 year to reach an all-time high in February.
On the other hand, limit down was also experienced in the 2008 financial crash. The markets plunged as traders feared the banking crisis would lead to a global recession, which it did.
Recession coming?
The one two punch of an oil price war, coronavirus outbreak escalation, combined with dismal data from China has investors fearing a global recession. It is impossible to tell right now how this will pan out. Limit down does not in itself mean that a recession will pursue. However, the bond market is pointing to some dark days ahead.
Circuit breaker level chart S&P
The toxic combination of an oil price collapse along with escalating coronavirus fears is setting the scene for one of the wildest days in years for global markets and US indices.
Panic selling is engulfing the markets as traders attempt to figure out how the oil price war and the rapid spread of coronavirus and the associated supply demand shock will impact the global economy.
Indices in Europe have plunged sharply in the European session. The FTSE experienced losses of 8.5% at its worst and US index futures have plunged 5%, indicating a sharp fall on the open. The panic exists because traders cannot quantify either the oil price war or the coronavirus impact. Markets hate uncertainty and recession fears are growing, fanned further by dismal data from China
Over in the US, futures trading was suspended in the Asian session on limit down after the S&P fell 5% making for a very uncertain US open.
What is limit down or circuit breaker?
A limit down price is the maximum sell-off permitted under NYSE rules in a market on a single day of trading. Once this level has been reached, the market is then suspended to prevent significant volatility and potential panic selling. A limit down price is typically determined as a percentage decline in a given market, rather than a nominal decline in price.
A limit down price is the maximum sell-off permitted under NYSE rules in a market on a single day of trading. Once this level has been reached, the market is then suspended to prevent significant volatility and potential panic selling. A limit down price is typically determined as a percentage decline in a given market, rather than a nominal decline in price.
Circuit breakers levels
There are three circuit breaker levels, when declines in the S&P breach 7% and 13%, trading will pause for 15 minutes. A 20% decline would shut trading for the rest of the day under current NYSE trading rules.
There are three circuit breaker levels, when declines in the S&P breach 7% and 13%, trading will pause for 15 minutes. A 20% decline would shut trading for the rest of the day under current NYSE trading rules.
Not the first time
This is not the first time that the markets have experienced limit down. US equity futures trading were limit down after President Trump’s surprise 2016 election. Whilst there was significant volatility on days following the results, this actually calmed relatively quickly and saw the US stock markets rally across the following 4 year to reach an all-time high in February.
On the other hand, limit down was also experienced in the 2008 financial crash. The markets plunged as traders feared the banking crisis would lead to a global recession, which it did.
Recession coming?
The one two punch of an oil price war, coronavirus outbreak escalation, combined with dismal data from China has investors fearing a global recession. It is impossible to tell right now how this will pan out. Limit down does not in itself mean that a recession will pursue. However, the bond market is pointing to some dark days ahead.
Circuit breaker level chart S&P
Related tags:




The complete CFD trading experience
Award-winning platforms, competitive spreads, low commissions and dedicated support.
We live and breathe the markets and are dedicated to helping traders realise their ambitions as we continue to set the industry bar.
Economic calendar
Web Trader platform
Our sophisticated web-based platform is packed with features.
Related articles

Crude Oil Analysis: Geopolitical Risk Continues to Drive the WTI Barrel Higher
During recent trading sessions, a new wave of buying momentum has continued to gain relevance around WTI crude oil price action. Over the last three trading sessions, the market has maintained a bullish streak and is now up more than 5.5%, highlighting significant buying pressure in the short term.

Crude Oil Forecast WTI Prices Come Under Pressure as Middle East Risks Ease
Over the last two trading sessions, WTI crude oil has once again displayed a notable bearish bias, with prices falling nearly 6%. Part of this renewed selling pressure has been driven by recent developments in the Middle East, which have helped temporarily ease the geopolitical tensions that had supported the oil risk premium in previous weeks.
Crude Oil Analysis WTI barrel remains weak after OPEC+ announcements
Crude oil continues to face difficult trading sessions in the short term. Over the last 5 trading sessions on average, WTI remains down close to -3.5%, with consistent movements below the 70-dollar area. This continues to highlight a selling bias that has remained in place for several weeks.
StoneX Europe Ltd may make third party material available on this website which may contain information included but not limited to the conditions of financial markets. The material is for information purposes only and does not contain, and should not be construed as containing, investment advice and/or investment recommendation and/or an investment research and/or an offer of or solicitation for any transactions in financial instruments; any decision to enter into a specific transaction shall be made by the client following an assessment by him/her of their situation.
StoneX Europe Ltd makes no representation or warranty and assumes no liability as to the accuracy or completeness of the information provided, nor any loss arising from any investment based on a recommendation, forecast or other information supplied. You should always seek independent advice as to your suitability to speculate in any related markets and your ability to assume the associated risks, if you are at all unsure. We are not under any obligation to update any such material. Any opinion made may be personal to the author and may not reflect the opinion of StoneX Europe Ltd.