


Nasdaq’s Uptrend Faces a Test as Silver Falters Below Historic Resistance
Tariff tensions between the US and China are capping gains in US indices as they cool off from overheated momentum levels, while gold and silver continue to stretch toward historical momentum extremes.
Share this:

Key Events
- Silver pulls back below its 45-year resistance.
- Nasdaq recovers on positive earnings and dovish Powell comments, though a full recovery remains in question.
- Tariff headlines and the ongoing US government shutdown continue to threaten market risk appetite.
Tariff tensions between the US and China have helped US indices ease their overheated momentum, while gold and silver approach stretched historical levels. Risk appetite seems to have hit resistance following upbeat US bank earnings from JPMorgan and Wells Fargo, alongside Powell’s dovish tone. Yet, uncertainty surrounding trade negotiations and the government shutdown keeps the full recovery in question.
Will tariff tensions trigger another downturn, or will progress on trade allow US indices to reclaim record highs — giving precious metals a chance to consolidate before resuming their broader uptrends?
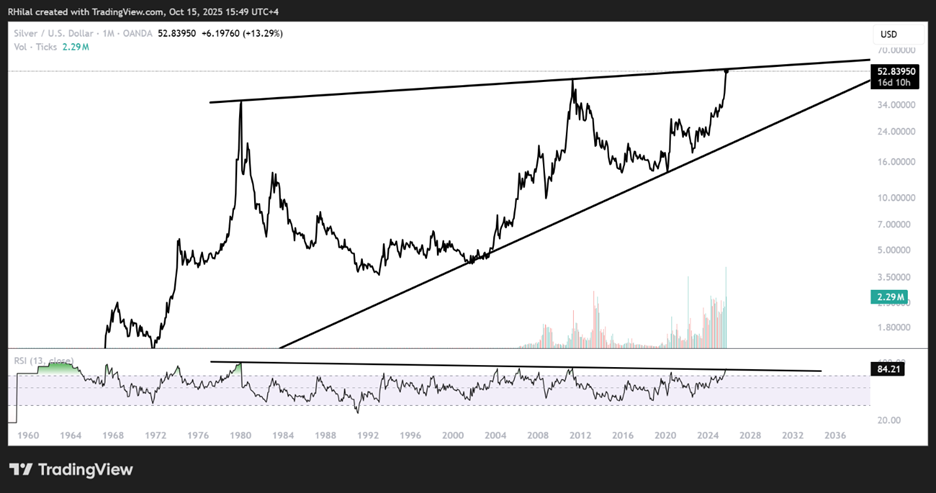
Silver Outlook: Monthly Time Frame – Log Scale
Source: Tradingview
Silver’s line chart has aligned with a 45-year resistance trendline stretching back to the 1980s, raising downside questions for the ongoing rally. With gold trading near $4,200 and silver pulling back from $53.60 toward the $51 level, the metal’s strength appears to be waning.
This setup may reflect broader shifts in market sentiment as investors balance Powell’s dovish tone with uncertainty around US–China trade negotiations.
Silver Outlook: Weekly Time Frame – Log Scale

Source: Tradingview
On the weekly chart, silver is eyeing the upper boundary of a duplicated uptrend channel respected since 2023, right near its 45-year resistance line. The lower channel boundaries could support any pullback around $47 and $44, aligning with the trendline connecting higher highs from 2023–2024.
On the upside, if silver holds above $53.60 and breaks through the long-term resistance from 1980, the rally could extend toward the channel’s upper border near the $56.50–$57.00 zone, before tracing a proper pullback to recharge the heated momentum.
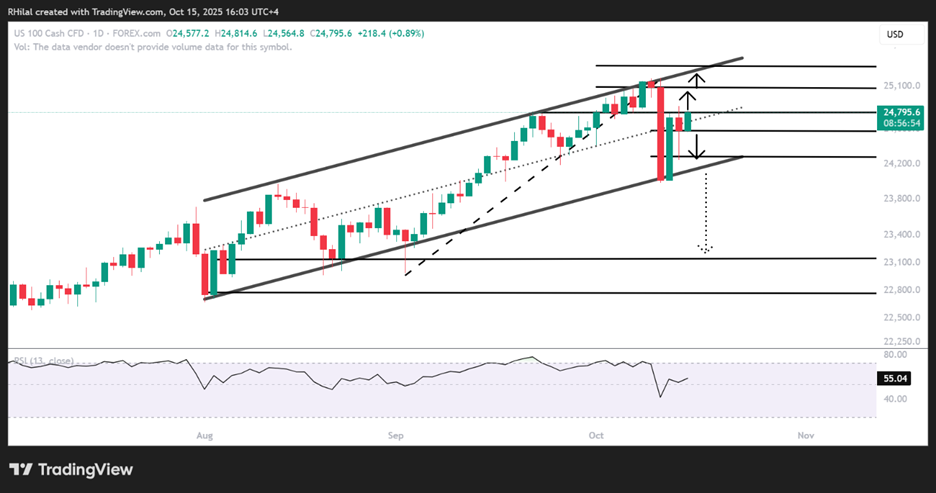
Nasdaq Outlook: Daily Time Frame – Log Scale
Source: Tradingview
The Nasdaq has successfully rebounded from the 24,000 support level — the lower boundary of its parallel ascending channel since August — and is now testing resistance near 24,800. A confirmed breakout above this zone could pave the way for further gains toward the 25,000–25,300 region.
However, a drop back below 24,500 may reopen downside risk toward 24,300 and 24,000. A sustained move below 23,900 could accelerate losses by another 1,000 points, targeting 23,100–22,900 respectively, mimicking the emotional sell off of April 2025.
Written by Razan Hilal, CMT
Follow on X: @Rh_waves
Related tags:


The complete CFD trading experience
Award-winning platforms, competitive spreads, low commissions and dedicated support.
We live and breathe the markets and are dedicated to helping traders realise their ambitions as we continue to set the industry bar.
Economic calendar
Web Trader platform
Our sophisticated web-based platform is packed with features.
Related articles
GBP/USD, DJIA Outlook: Support Levels Meet Oversold Risks
GBP/USD and the Dow test key support levels as rising Treasury yields, Fed rate-hike expectations and oversold momentum increase reversal risks.

Gold forecast: XAU/USD could take a larger dive after the big rise in yields
Gold prices have been falling in the last few days after last week’s post-FOMC pop faded amid rising interest rate expectations, higher oil prices and a strengthening US dollar. As before, I wasn’t convinced gold would thrive in the current macro backdrop.


Gold, silver slammed as hawkish Fed repricing reignites dollar upside
Gold and silver had held up surprisingly well against surging US yields. Wednesday’s DXY breakout may have changed that equation.

StoneX Europe Ltd may make third party material available on this website which may contain information included but not limited to the conditions of financial markets. The material is for information purposes only and does not contain, and should not be construed as containing, investment advice and/or investment recommendation and/or an investment research and/or an offer of or solicitation for any transactions in financial instruments; any decision to enter into a specific transaction shall be made by the client following an assessment by him/her of their situation.
StoneX Europe Ltd makes no representation or warranty and assumes no liability as to the accuracy or completeness of the information provided, nor any loss arising from any investment based on a recommendation, forecast or other information supplied. You should always seek independent advice as to your suitability to speculate in any related markets and your ability to assume the associated risks, if you are at all unsure. We are not under any obligation to update any such material. Any opinion made may be personal to the author and may not reflect the opinion of StoneX Europe Ltd.