



Natural gas plummets 14%
Natural gas plummets over 14% after an export terminal in the US announced a delay in returning to operation after an explosion. The natural gas market in Europe and Asia will tighten.
Share this:

Freeport warns over a delay to restarting operations
Natural gas prices have tumbled over 14% at the time of writing after the operator of the Texas export terminal, Freeport LNG, said that it could take 90 days to partially restart the facility after an explosion last week, and it may take the rest of the year to complete all repairs and return to full operation.
Freeport had initially said that the facility would be closed for a couple of weeks.
The more extended closure of the facility means that the US natural gas market will be oversupplied for a period, as the gas will remain in the US rather than being exported. This will loosen the LNG gas market in the US but tighten it globally, such as in Europe and Asia. The facility exported around 2 billion cubic feet of LNG per day, around 2% of US demand which, has been temporarily halted.
Producers aren’t about to cut back production in light of the Freeport LNG facility update.
Even so, natural gas prices are still up some 90% since the start of the year. While demand has rebounded as economies have reopened after COVID lockdowns, supply has remained tight.
Russia’s invasion of Ukraine tightened the market further. Europe is attempting to transition away from dependency on Russian energy, both gas, and oil. As a result, record quantities of US LNG are being directed toward Europe.
Soaring energy prices are adding to inflationary issues impacting the US and European economies. US CPI unexpectedly rose to 8.6% YoY in May.
Where next for Natural Gas?
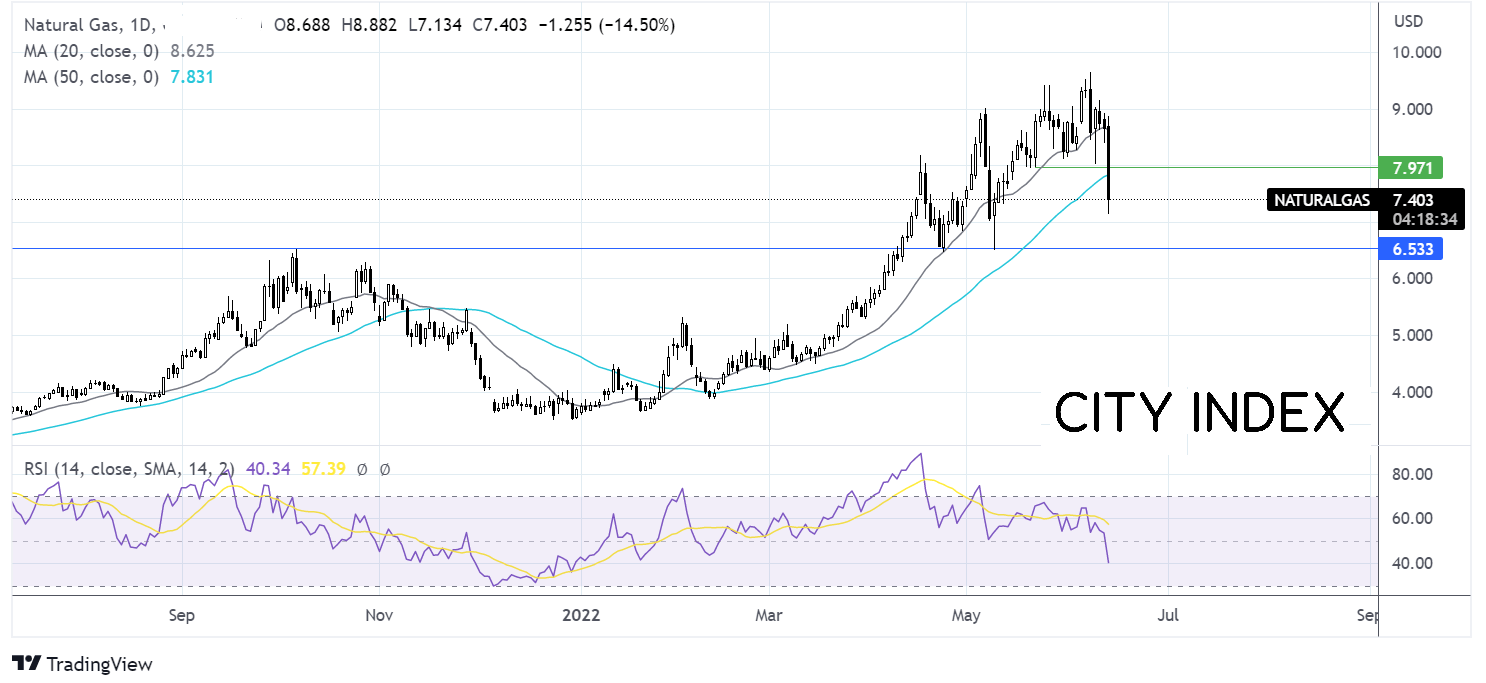
Natural Gas has plunged 14%, falling through the 20 and 50 sma before running into support at 7.134. This is the first time the price has traded below the 50 sma since late January, which, combined with the bearish RSI, could support further downside.
Sellers will need to break below yesterday’s low to extend the bearish move towards 6.500, the May low, and October high. A break below here would negate the near-term uptrend.
On the upside, resistance can be seen at 7.840, the 50 sma ahead of 8.00, the May 23 low and round number.

Freeport warns over a delay to restarting operations
Natural gas prices have tumbled over 14% at the time of writing after the operator of the Texas export terminal, Freeport LNG, said that it could take 90 days to partially restart the facility after an explosion last week, and it may take the rest of the year to complete all repairs and return to full operation.
Freeport had initially said that the facility would be closed for a couple of weeks.
The more extended closure of the facility means that the US natural gas market will be oversupplied for a period, as the gas will remain in the US rather than being exported. This will loosen the LNG gas market in the US but tighten it globally, such as in Europe and Asia. The facility exported around 2 billion cubic feet of LNG per day, around 2% of US demand which, has been temporarily halted.
Producers aren’t about to cut back production in light of the Freeport LNG facility update.
Even so, natural gas prices are still up some 90% since the start of the year. While demand has rebounded as economies have reopened after COVID lockdowns, supply has remained tight.
Russia’s invasion of Ukraine tightened the market further. Europe is attempting to transition away from dependency on Russian energy, both gas, and oil. As a result, record quantities of US LNG are being directed toward Europe.
Soaring energy prices are adding to inflationary issues impacting the US and European economies. US CPI unexpectedly rose to 8.6% YoY in May.
Learn more about trading natural gas
Where next for Natural Gas?
Natural Gas has plunged 14%, falling through the 20 and 50 sma before running into support at 7.134. This is the first time the price has traded below the 50 sma since late January, which, combined with the bearish RSI, could support further downside.
Sellers will need to break below yesterday’s low to extend the bearish move towards 6.500, the May low, and October high. A break below here would negate the near-term uptrend.
On the upside, resistance can be seen at 7.840, the 50 sma ahead of 8.00, the May 23 low and round number.
How to trade with City Index
You can trade with City Index by following these four easy steps:
- Open an account, or log in if you’re already a customer
• Open an account in the UK
• Open an account in Australia
• Open an account in Singapore
- Search for the market you want to trade in our award-winning platform
- Choose your position and size, and your stop and limit levels
- Place the trade
Related tags:
Latest market news




The complete CFD trading experience
Award-winning platforms, competitive spreads, low commissions and dedicated support.
We live and breathe the markets and are dedicated to helping traders realise their ambitions as we continue to set the industry bar.
Economic calendar
Web Trader platform
Our sophisticated web-based platform is packed with features.
Related articles
Gold Q4 2026 outlook: Resilience in the face of rallying dollar and yields
As we headed towards the latter stages of Q3 and into Q4, the Fed had just hiked rates in a hawkish FOMC meeting, while the likes of the ECB and BoJ had also tightened their respective policies. Oil prices remained elevated amid the prolonged US-Iran conflict. Meanwhile, bond yields were breaking out, and the dollar was higher across the board. Yet, remarkably, gold was still holding in the positive territory for the third quarter, even if it had weakened somewhat in September.

Oil Quietly Hands the Fed a Reason to Stay Hawkish
Oil prices and the U.S. dollar are both on the front foot as elevated energy costs feed Fed warnings that inflation may prove sticky.

S&P 500 forecast: Stocks extend drop as correction risks grow
US and global equity markets have extended Wednesday’s sell-off, with Wall Street opening lower after a weak handover from Asia and Europe. The deterioration in risk appetite has been spreading across global markets. The dollar was firmer, Treasury yields were holding onto yesterday’s gains, while gold, silver and bitcoin were all under pressure alongside equities and major currencies.
StoneX Europe Ltd may make third party material available on this website which may contain information included but not limited to the conditions of financial markets. The material is for information purposes only and does not contain, and should not be construed as containing, investment advice and/or investment recommendation and/or an investment research and/or an offer of or solicitation for any transactions in financial instruments; any decision to enter into a specific transaction shall be made by the client following an assessment by him/her of their situation.
StoneX Europe Ltd makes no representation or warranty and assumes no liability as to the accuracy or completeness of the information provided, nor any loss arising from any investment based on a recommendation, forecast or other information supplied. You should always seek independent advice as to your suitability to speculate in any related markets and your ability to assume the associated risks, if you are at all unsure. We are not under any obligation to update any such material. Any opinion made may be personal to the author and may not reflect the opinion of StoneX Europe Ltd.