







Nikkei 225 Index Have we seen this chart before
If the Nikkei 225 is going to move higher, it may look like the recent price action in GBP/USD!
Share this:

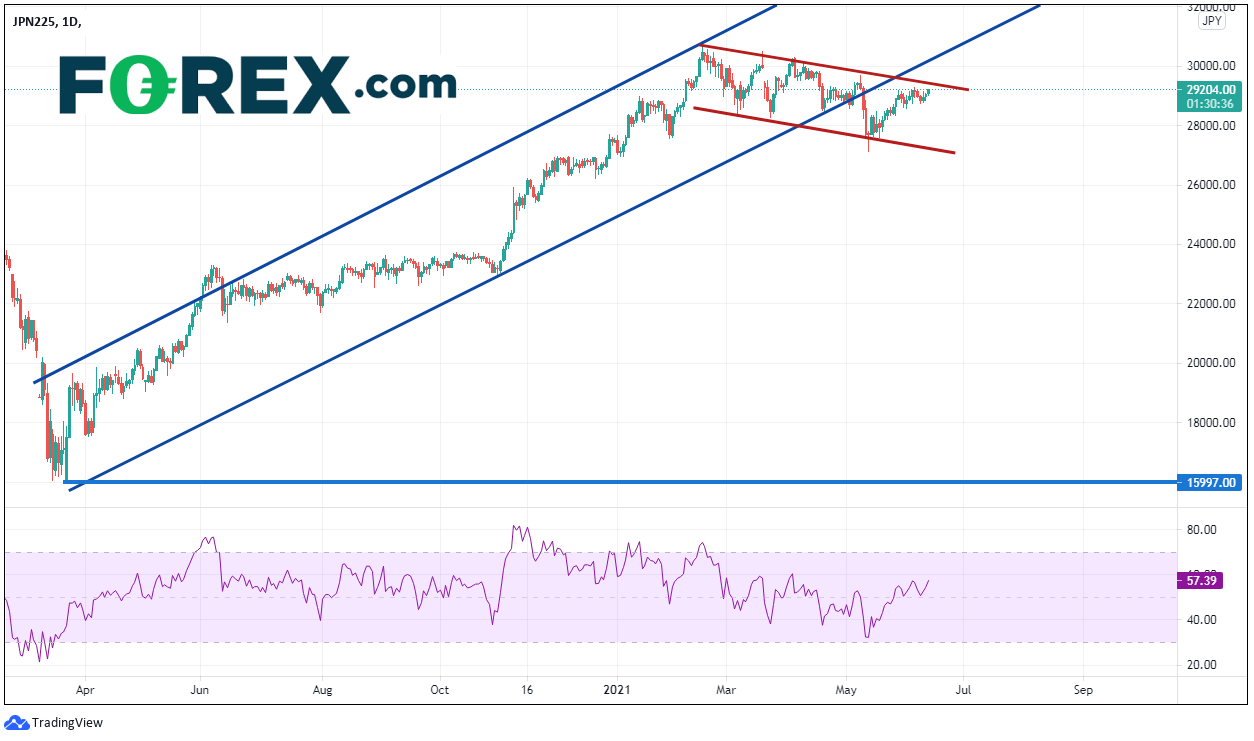
The Nikkei 225 Index had been trading in an orderly, ascending channel since the pandemic lows on March 24th 2020 near 15998. On February 16th, the index made a post pandemic high at resistance along the top trendline of the ascending channel near 30724. Often when price tests resistance on one side of a channel, it will move to test the other side of the channel (hence, this is how a channel is formed). For the Nikkei, price began moving lower and broke through the bottom trendline on May 11th. In doing so, price formed a shorter-term, corrective channel (red).
Source: Tradingview, City Index
Now, let’s look at a daily chart of GBP/USD from mid-September 2020. The pair been trading in an orderly, ascending channel since the lows on September 24th 2020 near 1.2667. On February 18th, price made a false breakout above the channel and put in a pos pandemic high near 1.4241. GBP/USD pulled back inside the channel on February 26th. Often when price tests resistance on one side of a channel, (or in this case, price has a false breakout), it will move to test the other side of a channel. For GBP/USD, price began moving lower and broke through the bottom trendline on April 29th. In doing so, price formed a short-term corrective channel (red).
Source: Tradingview, City Index
What happened next? On a 240-minute timeframe we can see that GBP/USD broke out of the corrective channel on May 7th near 1.3920, in the same direction as the prior trend (higher). Price tested resistance at the prior highs of 1.4241 (green), however has failed thus far to push through that level.
Source: Tradingview, City Index
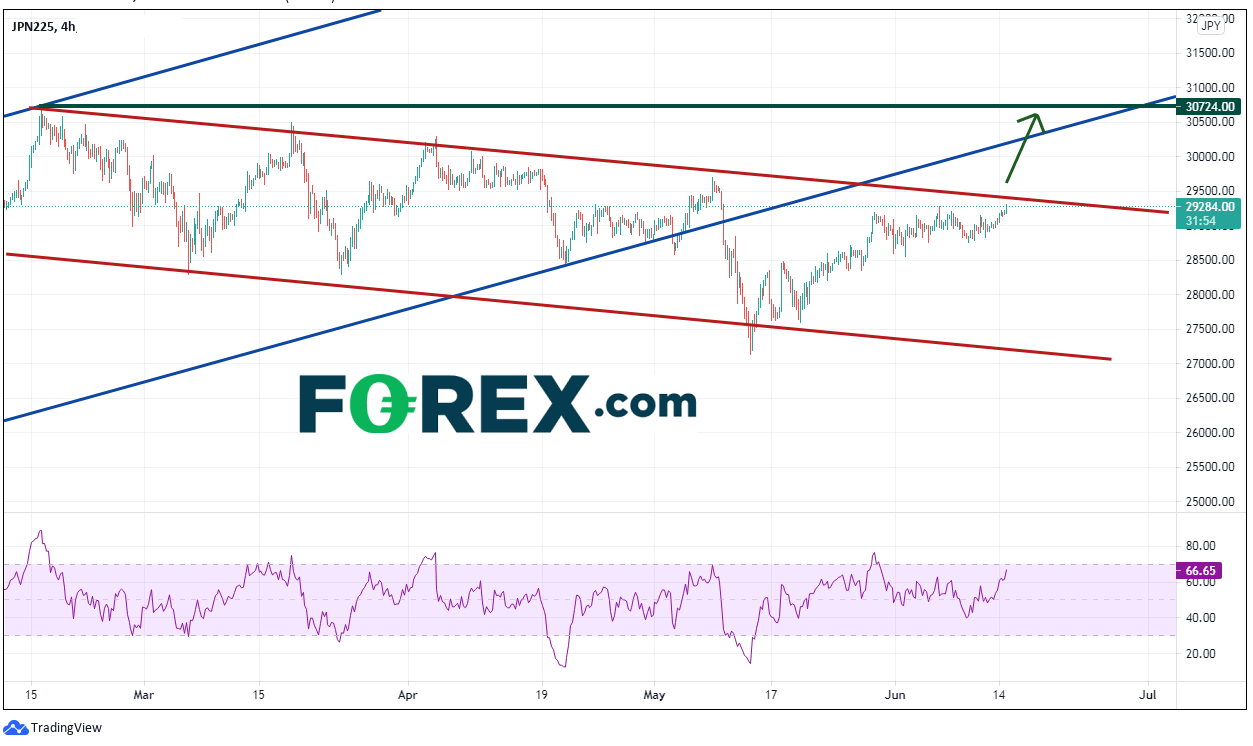
Could the Nikkei 225 Index act in the same manner us GBP/USD? If so, price may be ready to break out of the corrective channel near 29395, which would be in the same direction as the prior trend (higher). If the Nikkei does move higher, watch for it to test the highs from February 16th at 30724 (green). However, if price does hold at the near-term resistance, look for it to test the bottom trendline of the channel, near 27250.
Source: Tradingview, City Index
Technical analysis is about price patterns repeating themselves and prices moving in trends, with corrective waves within the trends. If the Nikkei 225 is going to move higher, it may look like the recent price action in GBP/USD!
Note that both the FOMC and the BOJ both meet later this week. The results of either meeting could cause volatility in stock market indices, including the Nikkei 225. See our complete Fed preview here.
Learn more about index trading opportunities.
The Nikkei 225 Index had been trading in an orderly, ascending channel since the pandemic lows on March 24th 2020 near 15998. On February 16th, the index made a post pandemic high at resistance along the top trendline of the ascending channel near 30724. Often when price tests resistance on one side of a channel, it will move to test the other side of the channel (hence, this is how a channel is formed). For the Nikkei, price began moving lower and broke through the bottom trendline on May 11th. In doing so, price formed a shorter-term, corrective channel (red).
Source: Tradingview, FOREX.com
Now, let’s look at a daily chart of GBP/USD from mid-September 2020. The pair been trading in an orderly, ascending channel since the lows on September 24th 2020 near 1.2667. On February 18th, price made a false breakout above the channel and put in a pos pandemic high near 1.4241. GBP/USD pulled back inside the channel on February 26th. Often when price tests resistance on one side of a channel, (or in this case, price has a false breakout), it will move to test the other side of a channel. For GBP/USD, price began moving lower and broke through the bottom trendline on April 29th. In doing so, price formed a short-term corrective channel (red).
Source: Tradingview, FOREX.com
What happened next? On a 240-minute timeframe we can see that GBP/USD broke out of the corrective channel on May 7th near 1.3920, in the same direction as the prior trend (higher). Price tested resistance at the prior highs of 1.4241 (green), however has failed thus far to push through that level.
Source: Tradingview, FOREX.com
Could the Nikkei 225 Index act in the same manner us GBP/USD? If so, price may be ready to break out of the corrective channel near 29395, which would be in the same direction as the prior trend (higher). If the Nikkei does move higher, watch for it to test the highs from February 16th at 30724 (green). However, if price does hold at the near-term resistance, look for it to test the bottom trendline of the channel, near 27250.
Source: Tradingview, FOREX.com
Technical analysis is about price patterns repeating themselves and prices moving in trends, with corrective waves within the trends. If the Nikkei 225 is going to move higher, it may look like the recent price action in GBP/USD!
Note that both the FOMC and the BOJ both meet later this week. The results of either meeting could cause volatility in stock market indices, including the Nikkei 225. See our complete Fed preview here.
Learn more about forex trading opportunities.
Related tags:
Latest market news



The complete CFD trading experience
Award-winning platforms, competitive spreads, low commissions and dedicated support.
We live and breathe the markets and are dedicated to helping traders realise their ambitions as we continue to set the industry bar.
Economic calendar
Web Trader platform
Our sophisticated web-based platform is packed with features.
Related articles
S&P 500 forecast: Stocks extend drop as correction risks grow
US and global equity markets have extended Wednesday’s sell-off, with Wall Street opening lower after a weak handover from Asia and Europe. The deterioration in risk appetite has been spreading across global markets. The dollar was firmer, Treasury yields were holding onto yesterday’s gains, while gold, silver and bitcoin were all under pressure alongside equities and major currencies.
Gold forecast: XAU/USD could take a larger dive after the big rise in yields
Gold prices have been falling in the last few days after last week’s post-FOMC pop faded amid rising interest rate expectations, higher oil prices and a strengthening US dollar. As before, I wasn’t convinced gold would thrive in the current macro backdrop.

Gold, silver slammed as hawkish Fed repricing reignites dollar upside
Gold and silver had held up surprisingly well against surging US yields. Wednesday’s DXY breakout may have changed that equation.

StoneX Europe Ltd may make third party material available on this website which may contain information included but not limited to the conditions of financial markets. The material is for information purposes only and does not contain, and should not be construed as containing, investment advice and/or investment recommendation and/or an investment research and/or an offer of or solicitation for any transactions in financial instruments; any decision to enter into a specific transaction shall be made by the client following an assessment by him/her of their situation.
StoneX Europe Ltd makes no representation or warranty and assumes no liability as to the accuracy or completeness of the information provided, nor any loss arising from any investment based on a recommendation, forecast or other information supplied. You should always seek independent advice as to your suitability to speculate in any related markets and your ability to assume the associated risks, if you are at all unsure. We are not under any obligation to update any such material. Any opinion made may be personal to the author and may not reflect the opinion of StoneX Europe Ltd.