



Norges Bank surprises and hikes 50bps
Concerns of a rising inflation with a tight labor market were the reasons for the greater magnitude in the hike.
Share this:

Norway’s Norges Bank surprised markets earlier by hiking rates 50bps from 0.75% to 1.25%. Expectations were only for a rate hike of 25bps. The Committee was primarily concerned with the risk of inflation moving higher than anticipated against the background of little spare capacity in the Norwegian economy. Norway’s CPI for May was 5.7% YoY vs 5.4% YoY in April. This was the highest level since December 1988. The central bank also increased their forecast for interest rates for 2023, from 2.5% at the end of next year to 3% in the middle of next year, while Norges Bank Governor Ida Wolden Bache said she is willing to raise rates by 50bps if needed. The Committee cut its GDP forecast as well, lowering this year’s forecast to 3.5% from 4.1% in March and the 2023 forecast to 1.1% vs 1.6% previously.
During the beginning of the Coronavirus pandemic in March 2020, USD/NOK rose from 9.2412 to a high of 12.1224! The pair then pulled back and made a low of 8.1477 during the week of April 26th, 2021. USD/NOK has slowly been grinding higher since then. With increasing expectations of higher interest rates from the Fed, the pair started moving aggressively higher in April of this year, forming a flag pattern which targets near 10.5225 on the weekly timeframe. However, the move out of the flag pattern has stalled at the 50% retracement level from the March 2020 highs to the April 26th, 2021 lows, near 10.1351.

Source: Tradingview, Stone X
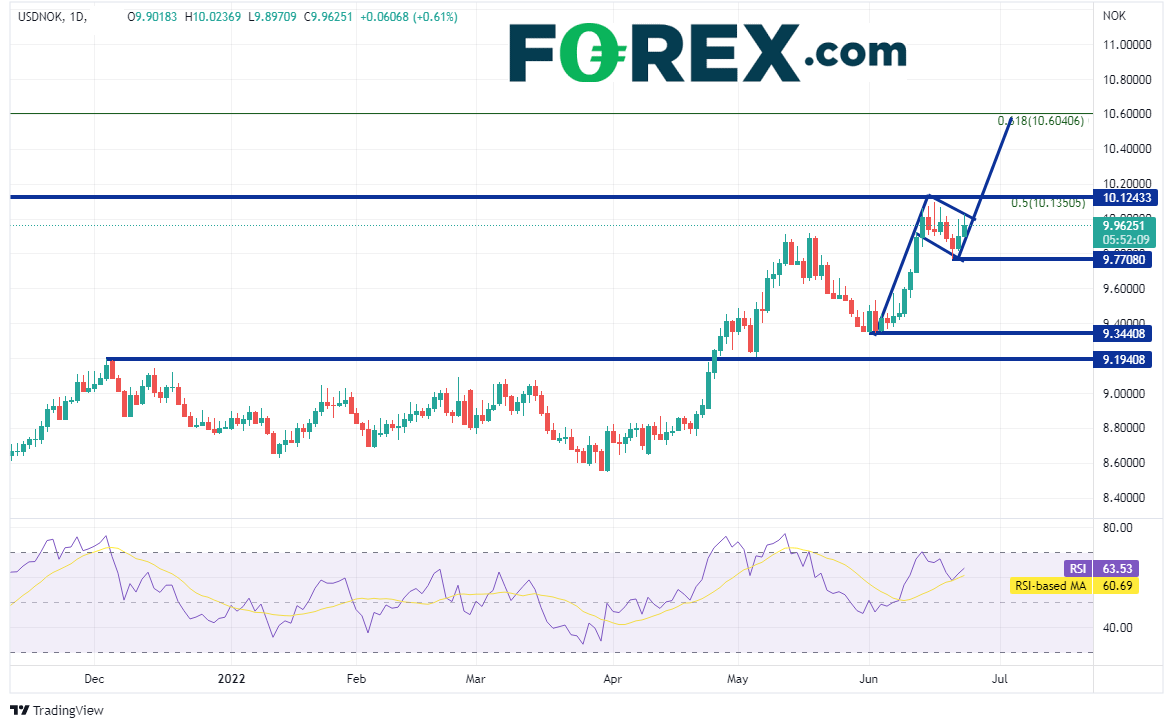
On a daily timeframe, the price of USD/NOK has made a flag pattern of its own. The target of for the flag pattern on the shorter timeframe is similar to that of the pattern on the weekly timeframe. However, if USD/NOK is to reach target, it must first pass through horizontal resistance and the previously mentioned 50% retracement level on the weekly timeframe near 10.1243/10.1351. Above there, the next resistance level isn’t until the 61.8% Fibonacci retracement from the March 2020 highs to the April 26th, 2021 lows at 10.6041. If the flag pattern fails and price moves lower, first support is at the lows of June 21st at 9.7708. Below there USD/NOK can fall to the lows of June 1st at 9.3441 and then additional horizontal support dating back to December 2021 near 9.1941.
Source: Tradingview, Stone X
The Norges Bank is the latest bank surprise markets with a 50bps rate hike. Concerns of a rising inflation with a tight labor market were the reasons for the greater magnitude in the hike. They are expected to raise rates by 25bps in August. Could the central bank surprise and hike 50bps again?
Norway’s Norges Bank surprised markets earlier by hiking rates 50bps from 0.75% to 1.25%. Expectations were only for a rate hike of 25bps. The Committee was primarily concerned with the risk of inflation moving higher than anticipated against the background of little spare capacity in the Norwegian economy. Norway’s CPI for May was 5.7% YoY vs 5.4% YoY in April. This was the highest level since December 1988. The central bank also increased their forecast for interest rates for 2023, from 2.5% at the end of next year to 3% in the middle of next year, while Norges Bank Governor Ida Wolden Bache said she is willing to raise rates by 50bps if needed. The Committee cut its GDP forecast as well, lowering this year’s forecast to 3.5% from 4.1% in March and the 2023 forecast to 1.1% vs 1.6% previously.
Trade USD/NOK now: Login or Open a new account!
• Open an account in the UK
• Open an account in Australia
• Open an account in Singapore
During the beginning of the Coronavirus pandemic in March 2020, USD/NOK rose from 9.2412 to a high of 12.1224! The pair then pulled back and made a low of 8.1477 during the week of April 26th, 2021. USD/NOK has slowly been grinding higher since then. With increasing expectations of higher interest rates from the Fed, the pair started moving aggressively higher in April of this year, forming a flag pattern which targets near 10.5225 on the weekly timeframe. However, the move out of the flag pattern has stalled at the 50% retracement level from the March 2020 highs to the April 26th, 2021 lows, near 10.1351.

Source: Tradingview, Stone X
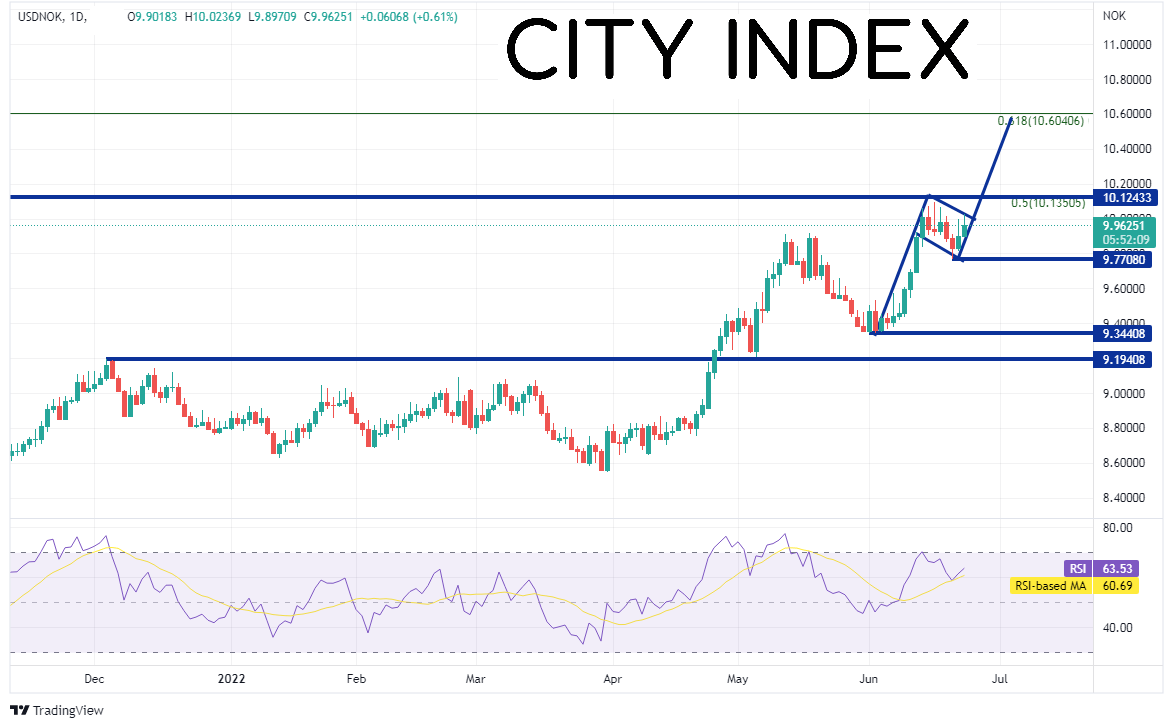
On a daily timeframe, the price of USD/NOK has made a flag pattern of its own. The target of for the flag pattern on the shorter timeframe is similar to that of the pattern on the weekly timeframe. However, if USD/NOK is to reach target, it must first pass through horizontal resistance and the previously mentioned 50% retracement level on the weekly timeframe near 10.1243/10.1351. Above there, the next resistance level isn’t until the 61.8% Fibonacci retracement from the March 2020 highs to the April 26th, 2021 lows at 10.6041. If the flag pattern fails and price moves lower, first support is at the lows of June 21st at 9.7708. Below there USD/NOK can fall to the lows of June 1st at 9.3441 and then additional horizontal support dating back to December 2021 near 9.1941.
Source: Tradingview, Stone X
The Norges Bank is the latest bank surprise markets with a 50bps rate hike. Concerns of a rising inflation with a tight labor market were the reasons for the greater magnitude in the hike. They are expected to raise rates by 25bps in August. Could the central bank surprise and hike 50bps again?
Learn more about forex trading opportunities.
Related tags:
Latest market news




The complete CFD trading experience
Award-winning platforms, competitive spreads, low commissions and dedicated support.
We live and breathe the markets and are dedicated to helping traders realise their ambitions as we continue to set the industry bar.
Economic calendar
Web Trader platform
Our sophisticated web-based platform is packed with features.
Related articles
USD/CAD reversal risk builds as central bank showdown looms
USD/CAD has delivered a bullish reversal signal from established support, just as traders prepare for Fed and BoC decisions. Aggressive Canadian rate hike expectations and conflicting momentum signals make the coming session important.
EUR/USD weekly outlook: FOMC and ECB to set the tone
The current backdrop is modestly bearish. On Friday, the EUR/USD closed modestly lower, down for the third consecutive day. The pair also posted a weekly decline after staging a modest recovery attempt in the previous week. Out of the past 8 weeks, the EUR/USD has fallen on 6 occasions. There is not much supporting factors for the single currency right now. So, the upside remains capped.


USD/JPY Forecast: Is Rising Japanese Inflation Supporting the Yen?
As the trading week comes to an end, one of the most relevant developments in the FX market has been the renewed strength of the Japanese yen. This can be seen in the recent performance of USD/JPY, which has fallen nearly 1.0% over the last two trading sessions, highlighting a meaningful recovery in the Japanese currency against the U.S. dollar.

StoneX Europe Ltd may make third party material available on this website which may contain information included but not limited to the conditions of financial markets. The material is for information purposes only and does not contain, and should not be construed as containing, investment advice and/or investment recommendation and/or an investment research and/or an offer of or solicitation for any transactions in financial instruments; any decision to enter into a specific transaction shall be made by the client following an assessment by him/her of their situation.
StoneX Europe Ltd makes no representation or warranty and assumes no liability as to the accuracy or completeness of the information provided, nor any loss arising from any investment based on a recommendation, forecast or other information supplied. You should always seek independent advice as to your suitability to speculate in any related markets and your ability to assume the associated risks, if you are at all unsure. We are not under any obligation to update any such material. Any opinion made may be personal to the author and may not reflect the opinion of StoneX Europe Ltd.