



NZD trades mixed after rate decision
A bearish technical event has been identified in the NZD/USD.
Share this:

The US Dollar was under pressure against all of its major pairs on Wednesday except for the GBP and JPY. On the U.S. economic data front, U.S. consumer prices rose 0.6% in July on month, above the 0.3% estimate following a 0.6% increase in June. Excluding food and fuel costs, core CPI also rose 0.6% from the prior month making it the largest gain since 1991. Finally, the July budget deficit narrowed to $63 billion from $119.7 billion a year ago.
On Thursday, jobless claims for the week ended Aug 8th are likely to come in at 1150K, down from 1186K in the prior week. Import prices are expected to continue to increase with a slight gain of 0.6% on month in July from a gain of 1.4% in June.
The Euro was higher against all of its major pairs except for the CHF. In Europe, the European Commission has reported June industrial production at +9.1% (vs +10.0% on month expected). The U.K. Office for National Statistics has posted 2Q GDP at -20.4% on quarter (vs -20.5% expected), June industrial production at +9.3 (vs +9.2% on month expected), manufacturing production at +11.0% (vs +10.0% on month expected) and trade balance at 5.3 billion pounds surplus (vs 2.6 billion pounds surplus expected).
The Australian dollar was mixed against all of its major pairs.
The Reserve Bank of New Zealand kept its key interest rate at 0.25%, which was widely expected by economists. The RBNZ is also expanding its large scale asset purchase program by up to $100 billion NZD.
Using the "technical Insight" research tool under the Market Analysis tab, our automated pattern recognition software has identified a bearish signal in the NZD/USD.
A triple moving average crossover (4-day, 9-day, 18 day)
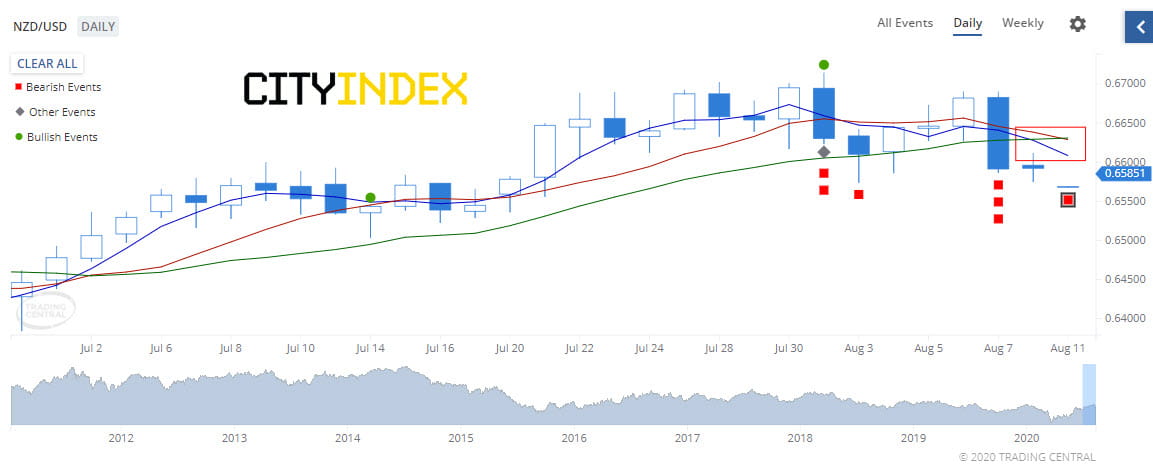
Source: GAIN Capital, "Technical Insight"
This tells us the currency pair is generally in an established trend (bullish or bearish) for the time horizon represented by the moving average periods.
Moving averages are used to smooth out the volatility or "noise" in the price series, to make it easier to discover the underlying trend. By plotting the average price over the last several bars, the line is less "jerky" than plotting the actual prices. In the triple crossover method, a bullish signal is generated when a faster moving average (4 bar) crosses above an intermediate moving average (9 bar), which in turn crosses above a slower moving average (18 bar). In this state, the price is likely in an established uptrend. The opposite is true when the 4 bar crosses below the 9 bar which in turn crosses below the 18 bar, triggering a bearish event like in this case.
Happy Trading
On Thursday, jobless claims for the week ended Aug 8th are likely to come in at 1150K, down from 1186K in the prior week. Import prices are expected to continue to increase with a slight gain of 0.6% on month in July from a gain of 1.4% in June.
The Euro was higher against all of its major pairs except for the CHF. In Europe, the European Commission has reported June industrial production at +9.1% (vs +10.0% on month expected). The U.K. Office for National Statistics has posted 2Q GDP at -20.4% on quarter (vs -20.5% expected), June industrial production at +9.3 (vs +9.2% on month expected), manufacturing production at +11.0% (vs +10.0% on month expected) and trade balance at 5.3 billion pounds surplus (vs 2.6 billion pounds surplus expected).
The Australian dollar was mixed against all of its major pairs.
The Reserve Bank of New Zealand kept its key interest rate at 0.25%, which was widely expected by economists. The RBNZ is also expanding its large scale asset purchase program by up to $100 billion NZD.
Using the "technical Insight" research tool under the Market Analysis tab, our automated pattern recognition software has identified a bearish signal in the NZD/USD.
A triple moving average crossover (4-day, 9-day, 18 day)
Source: GAIN Capital, "Technical Insight"
This tells us the currency pair is generally in an established trend (bullish or bearish) for the time horizon represented by the moving average periods.
Moving averages are used to smooth out the volatility or "noise" in the price series, to make it easier to discover the underlying trend. By plotting the average price over the last several bars, the line is less "jerky" than plotting the actual prices. In the triple crossover method, a bullish signal is generated when a faster moving average (4 bar) crosses above an intermediate moving average (9 bar), which in turn crosses above a slower moving average (18 bar). In this state, the price is likely in an established uptrend. The opposite is true when the 4 bar crosses below the 9 bar which in turn crosses below the 18 bar, triggering a bearish event like in this case.
Happy Trading
The US Dollar was under pressure against all of its major pairs on Wednesday except for the GBP and JPY. On the U.S. economic data front, U.S. consumer prices rose 0.6% in July on month, above the 0.3% estimate following a 0.6% increase in June. Excluding food and fuel costs, core CPI also rose 0.6% from the prior month making it the largest gain since 1991. Finally, the July budget deficit narrowed to $63 billion from $119.7 billion a year ago.
On Thursday, jobless claims for the week ended Aug 8th are likely to come in at 1150K, down from 1186K in the prior week. Import prices are expected to continue to increase with a slight gain of 0.6% on month in July from a gain of 1.4% in June.
The Euro was higher against all of its major pairs except for the CHF. In Europe, the European Commission has reported June industrial production at +9.1% (vs +10.0% on month expected). The U.K. Office for National Statistics has posted 2Q GDP at -20.4% on quarter (vs -20.5% expected), June industrial production at +9.3 (vs +9.2% on month expected), manufacturing production at +11.0% (vs +10.0% on month expected) and trade balance at 5.3 billion pounds surplus (vs 2.6 billion pounds surplus expected).
The Australian dollar was mixed against all of its major pairs.
The Reserve Bank of New Zealand kept its key interest rate at 0.25%, which was widely expected by economists. The RBNZ is also expanding its large scale asset purchase program by up to $100 billion NZD.
Using the "technical Insight" research tool under the Market Analysis tab, our automated pattern recognition software has identified a bearish signal in the NZD/USD.
A triple moving average crossover (4-day, 9-day, 18 day)

Source: GAIN Capital, "Technical Insight"
This tells us the currency pair is generally in an established trend (bullish or bearish) for the time horizon represented by the moving average periods.
Moving averages are used to smooth out the volatility or "noise" in the price series, to make it easier to discover the underlying trend. By plotting the average price over the last several bars, the line is less "jerky" than plotting the actual prices. In the triple crossover method, a bullish signal is generated when a faster moving average (4 bar) crosses above an intermediate moving average (9 bar), which in turn crosses above a slower moving average (18 bar). In this state, the price is likely in an established uptrend. The opposite is true when the 4 bar crosses below the 9 bar which in turn crosses below the 18 bar, triggering a bearish event like in this case.
Happy Trading
On Thursday, jobless claims for the week ended Aug 8th are likely to come in at 1150K, down from 1186K in the prior week. Import prices are expected to continue to increase with a slight gain of 0.6% on month in July from a gain of 1.4% in June.
The Euro was higher against all of its major pairs except for the CHF. In Europe, the European Commission has reported June industrial production at +9.1% (vs +10.0% on month expected). The U.K. Office for National Statistics has posted 2Q GDP at -20.4% on quarter (vs -20.5% expected), June industrial production at +9.3 (vs +9.2% on month expected), manufacturing production at +11.0% (vs +10.0% on month expected) and trade balance at 5.3 billion pounds surplus (vs 2.6 billion pounds surplus expected).
The Australian dollar was mixed against all of its major pairs.
The Reserve Bank of New Zealand kept its key interest rate at 0.25%, which was widely expected by economists. The RBNZ is also expanding its large scale asset purchase program by up to $100 billion NZD.
Using the "technical Insight" research tool under the Market Analysis tab, our automated pattern recognition software has identified a bearish signal in the NZD/USD.
A triple moving average crossover (4-day, 9-day, 18 day)
Source: GAIN Capital, "Technical Insight"
This tells us the currency pair is generally in an established trend (bullish or bearish) for the time horizon represented by the moving average periods.
Moving averages are used to smooth out the volatility or "noise" in the price series, to make it easier to discover the underlying trend. By plotting the average price over the last several bars, the line is less "jerky" than plotting the actual prices. In the triple crossover method, a bullish signal is generated when a faster moving average (4 bar) crosses above an intermediate moving average (9 bar), which in turn crosses above a slower moving average (18 bar). In this state, the price is likely in an established uptrend. The opposite is true when the 4 bar crosses below the 9 bar which in turn crosses below the 18 bar, triggering a bearish event like in this case.
Happy Trading


The complete CFD trading experience
Award-winning platforms, competitive spreads, low commissions and dedicated support.
We live and breathe the markets and are dedicated to helping traders realise their ambitions as we continue to set the industry bar.
Economic calendar
Web Trader platform
Our sophisticated web-based platform is packed with features.
Related articles

NZD/USD pressure mounts as payrolls looms large
NZD/USD has fallen sharply as Fed rate expectations reset higher, but extreme downside stretch and major support raise the risk of a violent counter-trend rebound.

US Core PCE Preview: Stale or Significant for the Fed
Core PCE inflation takes center stage Wednesday, with traders watching for signs of renewed price pressure and clues on whether the Fed could hike again in October.

Australian Dollar Forecast: AUD/USD Four-Week Slide Nears Critical Uptrend Support 9 29 2026
Aussie momentum has deteriorated sharply into quarter-end, with inflation, Core PCE and NFP on tap as AUD/USD closes in on a pivotal technical threshold.

StoneX Europe Ltd may make third party material available on this website which may contain information included but not limited to the conditions of financial markets. The material is for information purposes only and does not contain, and should not be construed as containing, investment advice and/or investment recommendation and/or an investment research and/or an offer of or solicitation for any transactions in financial instruments; any decision to enter into a specific transaction shall be made by the client following an assessment by him/her of their situation.
StoneX Europe Ltd makes no representation or warranty and assumes no liability as to the accuracy or completeness of the information provided, nor any loss arising from any investment based on a recommendation, forecast or other information supplied. You should always seek independent advice as to your suitability to speculate in any related markets and your ability to assume the associated risks, if you are at all unsure. We are not under any obligation to update any such material. Any opinion made may be personal to the author and may not reflect the opinion of StoneX Europe Ltd.