



Stocks don’t believe the Fed!
Does the Fed have it wrong? Bad data is good data for the stock market as it means that the Fed will raise rates as a slower pace
Share this:

Over the past few days, Fed member after Fed member has been on the wires talking about how the Federal Reserve still has a long way to go to tame inflation. They talked about the need to get inflation to target, even at the expense of a strong labor market. San Francisco Fed President Daly said that she would start with 50bps for September because that is what the data is telling her. But she went on to say that “if we just see inflation roaring ahead undauntedly, the labor market showing no signs of slowing, then we’ll be in a different position where a 75bps increase might be more appropriate”. However, stock indices don’t quite see it that way as they continue to bust a move higher.
Markets seems to think that the PMIs released over that last few days show signs of a slowing world economy. In addition, inflation data seems like it may have peaked. Housing prices are lower, and some price components of manufacturing data were lower as well, such as the Philly Fed Manufacturing Index and the ISM Manufacturing Index. Does the Fed have it wrong? Bad data is good data for the stock market as it means that the Fed will raise rates as a slower pace, and possibly even stop all together by Q1 of 2023! However, the next Fed meeting isn’t until the end of September, so there is a lot more data to see before then. For now, stock markets seem to be betting on a less hawkish Fed at the September meeting.
The S&P 500 has been moving lower since the beginning of the year. On June 17th, the large cap index made a new low for the year at 3636, posting a false breakout below the bottom trendline of a descending wedge. As is often the case, when price fails to break one side of a pattern, it moves to test the other side of the pattern. On July 19th, the S&P 500 broke aggressively above the top, downward sloping trendline of the descending wedge. Today, price broke above the 50% retracement level from the highs of March 29th to the lows of June 17th, near 4137.4. In addition, if today’s price closes above 4140.6, it will have formed a bullish engulfing pattern, indicating a possible further move higher. The next resistance is at the highs of May 30th at 4214.6, then the 61.8% Fibonacci retracement level of the recently mentioned timeframe near 4255.1. Above there, price can move to the highs of May 4th at 4308.6. However, if the Fed turns out to be correct, and inflation is still increasing, stocks may turn lower. The first horizontal support is at 3919.8. Below there, price can fall to a confluence of support at the top, downward sloping trendline of the long-term descending wedge and the lows of July 14th, near 3721.6. The next support level is the low from June 17th at 3638.8.

Source: Tradingview, Stone X
Trade the S&P 500 now: Login or open a new account!
Other US stock indices such as the NASDAQ 100 and the Russell 2000 have similar patterns. Both indices broke out of descending wedges and, today, broke above the 50% retracement level from the highs of March 29th to the lows of June 16th. Will stock indices continue to move higher? We may have to wait until Friday’s NFP data to find out!
Learn more about index trading opportunities.
Over the past few days, Fed member after Fed member has been on the wires talking about how the Federal Reserve still has a long way to go to tame inflation. They talked about the need to get inflation to target, even at the expense of a strong labor market. San Francisco Fed President Daly said that she would start with 50bps for September because that is what the data is telling her. But she went on to say that “if we just see inflation roaring ahead undauntedly, the labor market showing no signs of slowing, then we’ll be in a different position where a 75bps increase might be more appropriate”. However, stock indices don’t quite see it that way as they continue to bust a move higher.
Everything you need to know about the Federal Reserve
Markets seems to think that the PMIs released over that last few days show signs of a slowing world economy. In addition, inflation data seems like it may have peaked. Housing prices are lower, and some price components of manufacturing data were lower as well, such as the Philly Fed Manufacturing Index and the ISM Manufacturing Index. Does the Fed have it wrong? Bad data is good data for the stock market as it means that the Fed will raise rates as a slower pace, and possibly even stop all together by Q1 of 2023! However, the next Fed meeting isn’t until the end of September, so there is a lot more data to see before then. For now, stock markets seem to be betting on a less hawkish Fed at the September meeting.
The S&P 500 has been moving lower since the beginning of the year. On June 17th, the large cap index made a new low for the year at 3636, posting a false breakout below the bottom trendline of a descending wedge. As is often the case, when price fails to break one side of a pattern, it moves to test the other side of the pattern. On July 19th, the S&P 500 broke aggressively above the top, downward sloping trendline of the descending wedge. Today, price broke above the 50% retracement level from the highs of March 29th to the lows of June 17th, near 4137.4. In addition, if today’s price closes above 4140.6, it will have formed a bullish engulfing pattern, indicating a possible further move higher. The next resistance is at the highs of May 30th at 4214.6, then the 61.8% Fibonacci retracement level of the recently mentioned timeframe near 4255.1. Above there, price can move to the highs of May 4th at 4308.6. However, if the Fed turns out to be correct, and inflation is still increasing, stocks may turn lower. The first horizontal support is at 3919.8. Below there, price can fall to a confluence of support at the top, downward sloping trendline of the long-term descending wedge and the lows of July 14th, near 3721.6. The next support level is the low from June 17th at 3638.8.
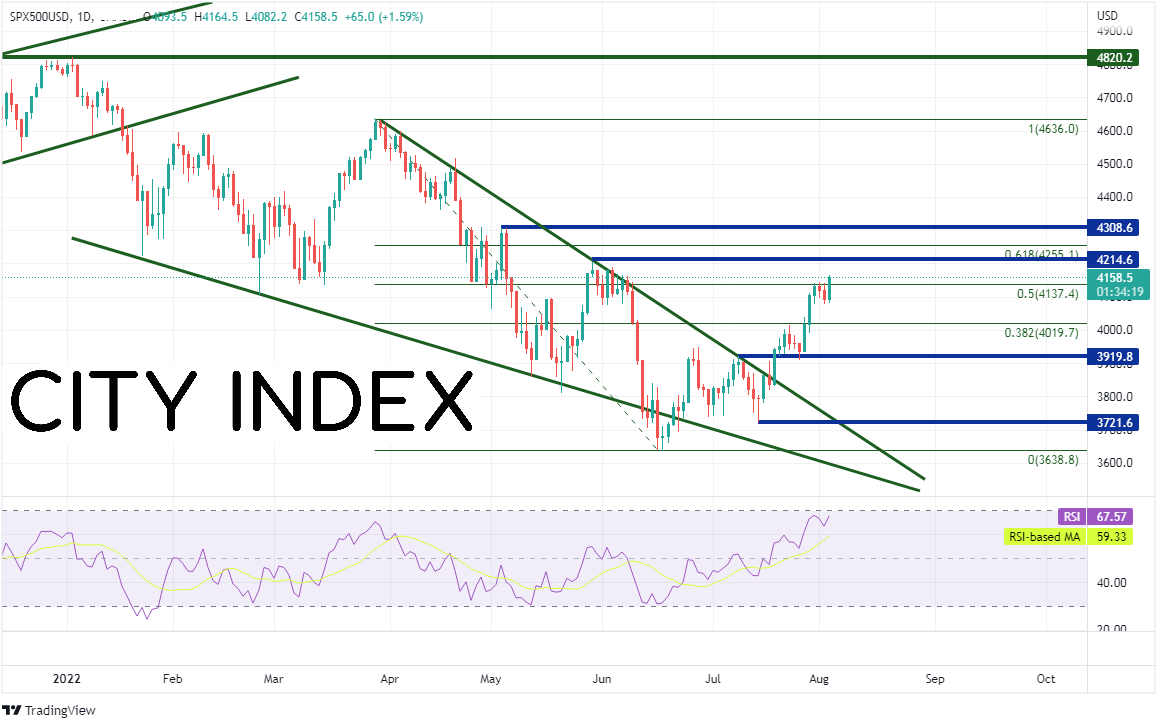
Source: Tradingview, Stone X
Trade the S&P 500 now: Login or Open a new account!
• Open an account in the UK
• Open an account in Australia
• Open an account in Singapore
Other US stock indices such as the NASDAQ 100 and the Russell 2000 have similar patterns. Both indices broke out of descending wedges and, today, broke above the 50% retracement level from the highs of March 29th to the lows of June 16th. Will stock indices continue to move higher? We may have to wait until Friday’s NFP data to find out!
Learn more about index trading opportunities.
Related tags:
Latest market news




The complete CFD trading experience
Award-winning platforms, competitive spreads, low commissions and dedicated support.
We live and breathe the markets and are dedicated to helping traders realise their ambitions as we continue to set the industry bar.
Economic calendar
Web Trader platform
Our sophisticated web-based platform is packed with features.
Related articles
Gold Q4 2026 outlook: Resilience in the face of rallying dollar and yields
As we headed towards the latter stages of Q3 and into Q4, the Fed had just hiked rates in a hawkish FOMC meeting, while the likes of the ECB and BoJ had also tightened their respective policies. Oil prices remained elevated amid the prolonged US-Iran conflict. Meanwhile, bond yields were breaking out, and the dollar was higher across the board. Yet, remarkably, gold was still holding in the positive territory for the third quarter, even if it had weakened somewhat in September.
Equity Indices Q4, 2026 Outlook: Cracks Begin to Show
There's still an open door for a melt-up in the S&P 500 and Nasdaq but the Dow and Russell 2000 are looking more vulnerable, and until calm hits the Treasuries market there's a higher probability for volatility. The big question is whether that's a next quarter theme or not.

S&P 500 Forecast: SPX rises as oil prices fall, but treasuries remain at multi-decade highs
U.S. stocks are rising on Friday after a volatile week that saw a surge in Treasury yields ripple through financial markets.
StoneX Europe Ltd may make third party material available on this website which may contain information included but not limited to the conditions of financial markets. The material is for information purposes only and does not contain, and should not be construed as containing, investment advice and/or investment recommendation and/or an investment research and/or an offer of or solicitation for any transactions in financial instruments; any decision to enter into a specific transaction shall be made by the client following an assessment by him/her of their situation.
StoneX Europe Ltd makes no representation or warranty and assumes no liability as to the accuracy or completeness of the information provided, nor any loss arising from any investment based on a recommendation, forecast or other information supplied. You should always seek independent advice as to your suitability to speculate in any related markets and your ability to assume the associated risks, if you are at all unsure. We are not under any obligation to update any such material. Any opinion made may be personal to the author and may not reflect the opinion of StoneX Europe Ltd.