




Two trades to watch EURGBP Dow Jones
EUR/GBP rises despite encouraging UK labour market data. Dow Jones eases from all time highs ahead of US retail sales & Powell.
Share this:

EUR/GBP rises despite encouraging UK labour report
EUR/GBP is edging higher despite upbeat UK labour market data and ahead of Eurozone Q2 GDP data.
UK saw 95k new jobs added in May, well ahead of the 75k forecast and 25k in April
Unemployment ticked lower to 4.7% in the three months to June down from 4.8%
Wage growth rises to 8.8% YoY vs 8.5% forecast
Eurozone Q2 GDP also due – this is the second estimate so not expected to be as market moving as the first unless there is a significant difference. 2% QoQ growth expected.
Where next for EUR/GBP?
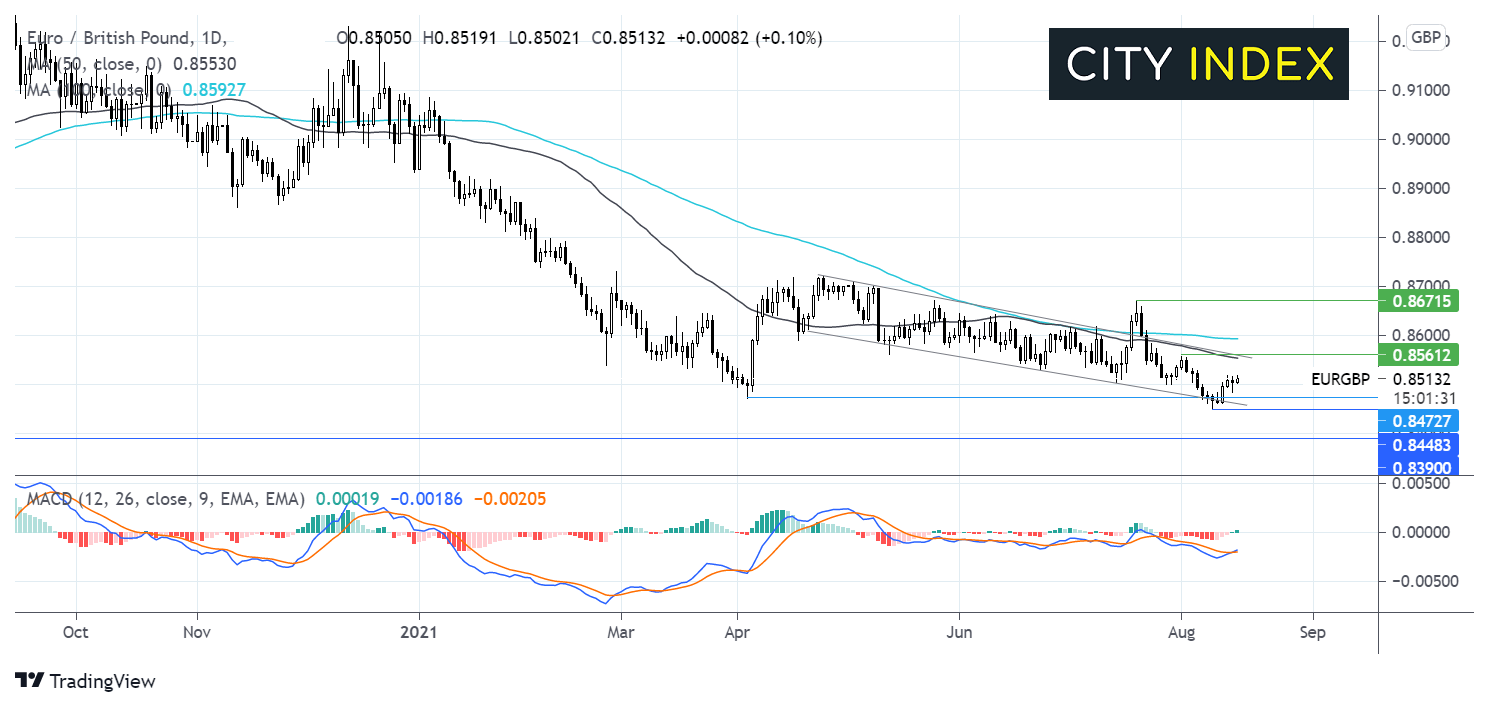
The pair has trended lower across the year, its has been trading in a descending channel since late April and trades below 50 & 100 dma is established bearish trend.
The pair bounced off the fresh 18-month low of 1.8450 hit last week and has retaken 0.85. The bullish crossover on the MACD supports further upside.
Buyers will need to overcome resistance at 0.8560, the confluence of the 50 dma, the upper band of the descending channel and the August high, which could prove a tough nut to crack. A break-through this level could see 0.8590 the 100 dma tested with a move above here negating the near term downtrend, bringing 0.8670 the July high into sight.
On the down side 0.8470 the April low could offer some support ahead of 0.8450 the 18 month low and the lower band of the descending channel. Beyond here 0.8390 a level last seen in January 2020 could come into play.
Dow Jones eases back from all time high ahead of US retail sales, Powell
Risk off is dominating the markets on Tuesday amid rising covid cases in China and tighter lockdown restrictions. The unfolding geopolitical situation in Afghanistan is adding to the down beat mood.
US retail sales data is in focus, expectations are for a -0.2% MoM decline after an unexpected rise in June to 0.6%.
Data on Friday revealed that US consumer confidence was at the lowest level for almost a decade. Weaker consumer morale often means that consumers rein in spending. Will we see this in the retail sales data?
Fed Chair Powell is also du to speak. Any clues that the Fed is laying the groundwork towards tightening monetary policy could fuel the rotation into cyclicals.
Home Depot is due to report.
Where next for the Dow Jones?
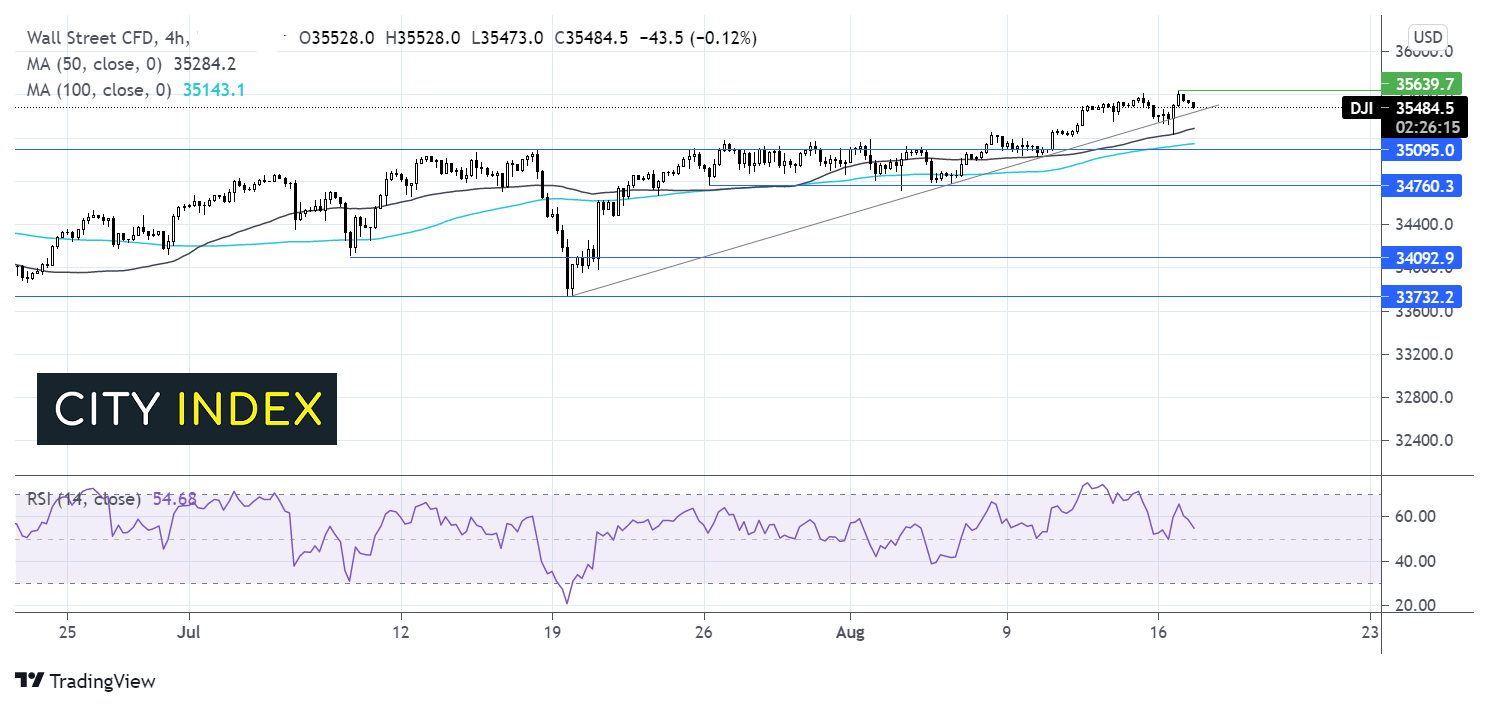
The Dow Jones has been trending firmly higher after rebounding of the July low of 33737, hitting a fresh all time high of 35630 in the previous session.
The index trades above its multi-week ascending trendline and above its 50 & 100 sma on the 4 hour chart in an established bullish trend.
The RSI remains in bullish territory. However, it points lower giving mixed signals.
Any meaning full move southwards would need to over the ascending trendline support at 35430 followed by the 50 sma at 35285 and the 100 sma 35140, this has proved to be a strong support in the past and a move below here would negate the near term up trend. It would take a move below 34750 for the sellers to gain traction.
Any move higher would need to push above 35640 to reach fresh all time highs.
How to trade with FOREX.com
Follow these easy steps to start trading with FOREX.com today:
- Open a Forex.com account, or log-in if you’re already a customer.
- Search for the market you want to trade in our award-winning platform.
- Choose your position and size, and your stop and limit levels.
- Place the trade.
EUR/GBP rises despite encouraging UK labour report
EUR/GBP is edging higher despite upbeat UK labour market data and ahead of Eurozone Q2 GDP data.
UK saw 95k new jobs added in May, well ahead of the 75k forecast and 25k in April
Unemployment ticked lower to 4.7% in the three months to June down from 4.8%
Wage growth rises to 8.8% YoY vs 8.5% forecast
Eurozone Q2 GDP also due – this is the second estimate so not expected to be as market moving as the first unless there is a significant difference. 2% QoQ growth expected.
Where next for EUR/GBP?
The pair has trended lower across the year, its has been trading in a descending channel since late April and trades below 50 & 100 dma is established bearish trend.
The pair bounced off the fresh 18-month low of 1.8450 hit last week and has retaken 0.85. The bullish crossover on the MACD supports further upside.
Buyers will need to overcome resistance at 0.8560, the confluence of the 50 dma, the upper band of the descending channel and the August high, which could prove a tough nut to crack. A break-through this level could see 0.8590 the 100 dma tested with a move above here negating the near term downtrend, bringing 0.8670 the July high into sight.
On the down side 0.8470 the April low could offer some support ahead of 0.8450 the 18 month low and the lower band of the descending channel. Beyond here 0.8390 a level last seen in January 2020 could come into play.
Dow Jones eases back from all time high ahead of US retail sales, Powell
Risk off is dominating the markets on Tuesday amid rising covid cases in China and tighter lockdown restrictions. The unfolding geopolitical situation in Afghanistan is adding to the down beat mood.
US retail sales data is in focus, expectations are for a -0.2% MoM decline after an unexpected rise in June to 0.6%.
Data on Friday revealed that US consumer confidence was at the lowest level for almost a decade. Weaker consumer morale often means that consumers rein in spending. Will we see this in the retail sales data?
Fed Chair Powell is also du to speak. Any clues that the Fed is laying the groundwork towards tightening monetary policy could fuel the rotation into cyclicals.
Home Depot is due to report.
Where next for the Dow Jones?
The Dow Jones has been trending firmly higher after rebounding of the July low of 33737, hitting a fresh all time high of 35630 in the previous session.
The index trades above its multi-week ascending trendline and above its 50 & 100 sma on the 4 hour chart in an established bullish trend.
The RSI remains in bullish territory. However, it points lower giving mixed signals.
Any meaning full move southwards would need to over the ascending trendline support at 35430 followed by the 50 sma at 35285 and the 100 sma 35140, this has proved to be a strong support in the past and a move below here would negate the near term up trend. It would take a move below 34750 for the sellers to gain traction.
Any move higher would need to push above 35640 to reach fresh all time highs.
How to trade with City Index
Follow these easy steps to start trading with City Index today:
- Open a City Index account, or log-in if you’re already a customer.
- Search for the market you want to trade in our award-winning platform.
- Choose your position and size, and your stop and limit levels
- Place the trade.

The complete CFD trading experience
Award-winning platforms, competitive spreads, low commissions and dedicated support.
We live and breathe the markets and are dedicated to helping traders realise their ambitions as we continue to set the industry bar.
Economic calendar
Web Trader platform
Our sophisticated web-based platform is packed with features.
Related articles
Japanese Yen Forecast: USD/JPY 4% Rally Challenges Post-Intervention Downtrend 9 24 2026
USD/JPY momentum has shifted sharply higher, putting a major resistance confluence in focus as U.S. and Japanese event risk builds.

Oil Quietly Hands the Fed a Reason to Stay Hawkish
Oil prices and the U.S. dollar are both on the front foot as elevated energy costs feed Fed warnings that inflation may prove sticky.


Wall Street Forecast: DJIA falls as treasury yields hit new highs and ahead of the Trump-Xi summit
U.S. stocks are falling, further extending losses from the previous session, as oil prices move higher alongside Treasury yields and caution reigns ahead of the summit between President Trump and Xi Jinping.
StoneX Europe Ltd may make third party material available on this website which may contain information included but not limited to the conditions of financial markets. The material is for information purposes only and does not contain, and should not be construed as containing, investment advice and/or investment recommendation and/or an investment research and/or an offer of or solicitation for any transactions in financial instruments; any decision to enter into a specific transaction shall be made by the client following an assessment by him/her of their situation.
StoneX Europe Ltd makes no representation or warranty and assumes no liability as to the accuracy or completeness of the information provided, nor any loss arising from any investment based on a recommendation, forecast or other information supplied. You should always seek independent advice as to your suitability to speculate in any related markets and your ability to assume the associated risks, if you are at all unsure. We are not under any obligation to update any such material. Any opinion made may be personal to the author and may not reflect the opinion of StoneX Europe Ltd.