





USDJPY on the Move with Risk
USD/JPY is highly correlated with S&P 500
Share this:

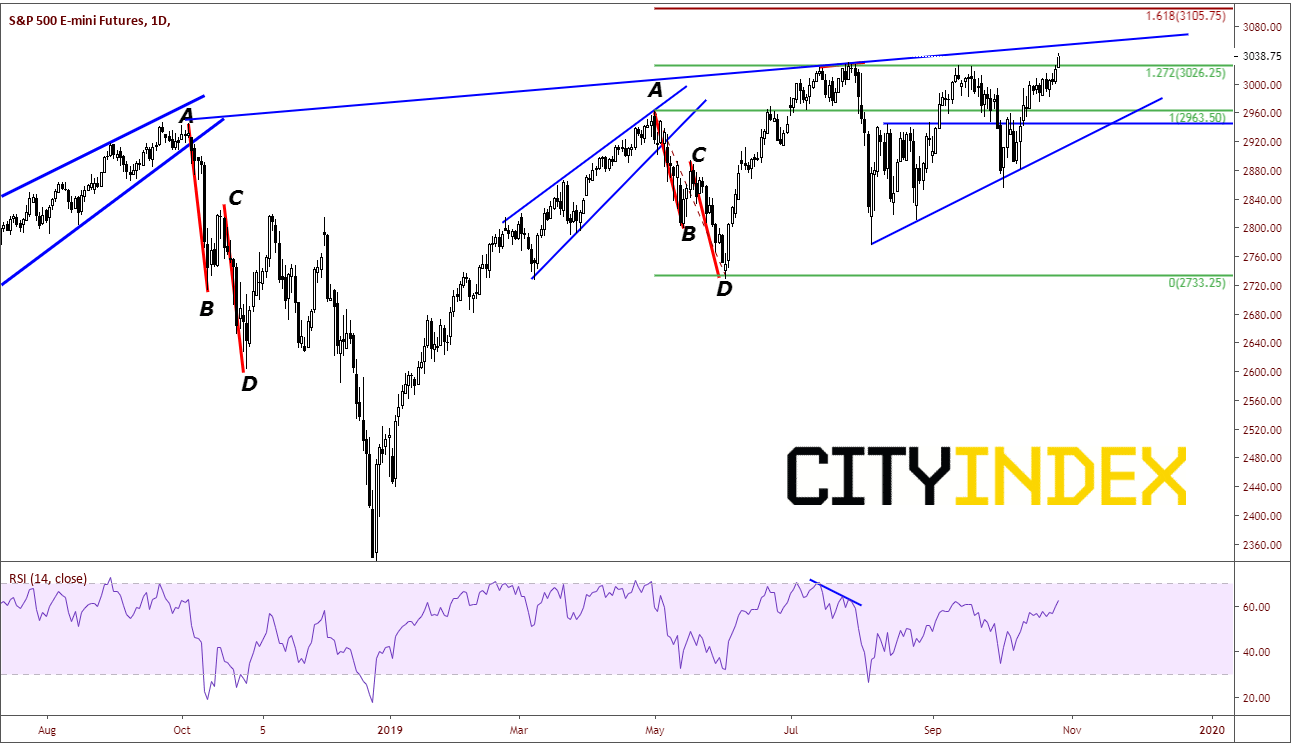
As US stock markets were teetering near all-time highs this morning, President Trump said that “We are looking to be ahead of schedule to sign Phase One of the US-China trade deal” and that he expects to sign the China Trade Pact as APEC in meeting in Chile, according to Reuters. And with that, stocks catapulted to new highs! S&P 500 futures currently trading near their highs at 3042.75. First target on the upside for the index is the upsloping trendline connecting tops from October 2018 near 3050. Next target is the 161.8% extension from the April 30th highs to the June 3rd lows, with is 3105.75.
Source: Tradingview, CME, City Index
As stocks are making new highs, the USD/JPY is making a move higher with risk on. USD/JPY is highly correlated with S&P 500 at the moment, with a correlation coefficient of +.96! This means that if stocks move higher, USD/JPY tends to move higher. If stocks move lower, USD/JPY tends to move lower.
Source: Tradingview, CME, City Index
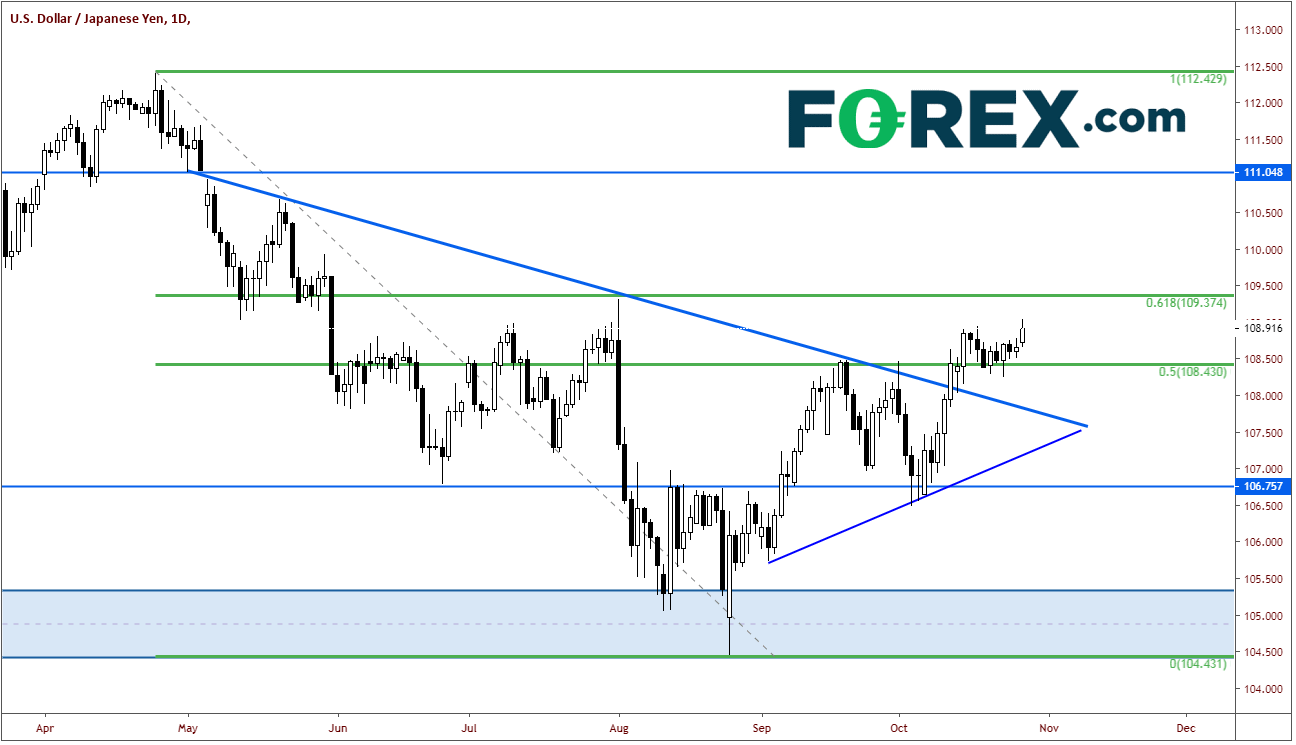
The Bank of Japan is having their rate decision on Friday, and it is expected that the Bank with provide more accommodation due to the recent fall in exports, as my colleague Fawad pointed out the Week Ahead (however some are suggesting that they may hold off until next month). With stocks on the rise, and the possibility of more easing from the BOJ, it’s no surprise that USD/JPY is moving higher. In addition, the pair recently broke through the downward sloping trendline from May 2nd, and through 109.00 for the first time since August 1st. There is resistance at 109.37, which is the 61.8% retracement from the highs on April 24th to the lows on August 26th. There is also horizonal resistance near this level. However, if it breaks through, USD/JPY could run up to the gap fill near 111.00 quickly.
Source: Tradingview, City Index
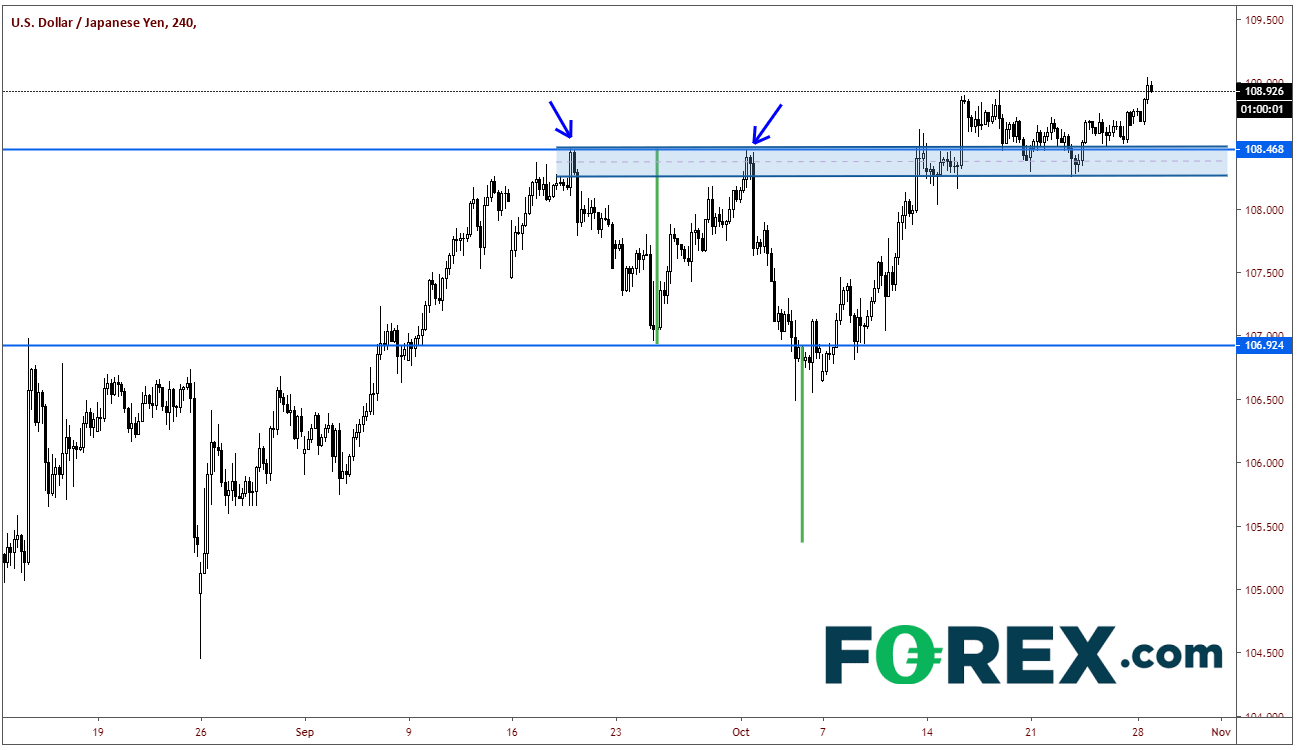
On a 240-minute chart, the USD/JPY shook out weak shorts in the market with the failure to continue lower after breaking thought the bottom of the double top pattern. The pair then went back up to the highs near 108.50 and took out shorts there as well. Currently, there is a strong support zone between 108.25 and 108.50. Below that, support comes in back at the prior lows of the double top near 107.00.
Source: Tradingview, City Index
If you are trading USD/JPY, make sure to pay attention to stocks. If stocks have a sudden move, you can be sure USD/JPY will follow given the current correlation!
As US stock markets were teetering near all-time highs this morning, President Trump said that “We are looking to be ahead of schedule to sign Phase One of the US-China trade deal” and that he expects to sign the China Trade Pact as APEC in meeting in Chile, according to Reuters. And with that, stocks catapulted to new highs! S&P 500 futures currently trading near their highs at 3042.75. First target on the upside for the index is the upsloping trendline connecting tops from October 2018 near 3050. Next target is the 161.8% extension from the April 30th highs to the June 3rd lows, with is 3105.75.
Source: Tradingview, CME, FOREX.com
As stocks are making new highs, the USD/JPY is making a move higher with risk on. USD/JPY is highly correlated with S&P 500 at the moment, with a correlation coefficient of +.96! This means that if stocks move higher, USD/JPY tends to move higher. If stocks move lower, USD/JPY tends to move lower.
Source: Tradingview, CME, FOREX.com
The Bank of Japan is having their rate decision on Friday, and it is expected that the Bank with provide more accommodation due to the recent fall in exports, as my colleague Fawad pointed out the Week Ahead (however some are suggesting that they may hold off until next month). With stocks on the rise, and the possibility of more easing from the BOJ, it’s no surprise that USD/JPY is moving higher. In addition, the pair recently broke through the downward sloping trendline from May 2nd, and through 109.00 for the first time since August 1st. There is resistance at 109.37, which is the 61.8% retracement from the highs on April 24th to the lows on August 26th. There is also horizonal resistance near this level. However, if it breaks through, USD/JPY could run up to the gap fill near 111.00 quickly.
Source: Tradingview, FOREX.com
On a 240-minute chart, the USD/JPY shook out weak shorts in the market with the failure to continue lower after breaking thought the bottom of the double top pattern. The pair then went back up to the highs near 108.50 and took out shorts there as well. Currently, there is a strong support zone between 108.25 and 108.50. Below that, support comes in back at the prior lows of the double top near 107.00.
Source: Tradingview, FOREX.com
If you are trading USD/JPY, make sure to pay attention to stocks. If stocks have a sudden move, you can be sure USD/JPY will follow given the current correlation!

The complete CFD trading experience
Award-winning platforms, competitive spreads, low commissions and dedicated support.
We live and breathe the markets and are dedicated to helping traders realise their ambitions as we continue to set the industry bar.
Economic calendar
Web Trader platform
Our sophisticated web-based platform is packed with features.
Related articles

NZD/USD pressure mounts as payrolls looms large
NZD/USD has fallen sharply as Fed rate expectations reset higher, but extreme downside stretch and major support raise the risk of a violent counter-trend rebound.


US Core PCE Preview: Stale or Significant for the Fed
Core PCE inflation takes center stage Wednesday, with traders watching for signs of renewed price pressure and clues on whether the Fed could hike again in October.


Australian Dollar Forecast: AUD/USD Four-Week Slide Nears Critical Uptrend Support 9 29 2026
Aussie momentum has deteriorated sharply into quarter-end, with inflation, Core PCE and NFP on tap as AUD/USD closes in on a pivotal technical threshold.

StoneX Europe Ltd may make third party material available on this website which may contain information included but not limited to the conditions of financial markets. The material is for information purposes only and does not contain, and should not be construed as containing, investment advice and/or investment recommendation and/or an investment research and/or an offer of or solicitation for any transactions in financial instruments; any decision to enter into a specific transaction shall be made by the client following an assessment by him/her of their situation.
StoneX Europe Ltd makes no representation or warranty and assumes no liability as to the accuracy or completeness of the information provided, nor any loss arising from any investment based on a recommendation, forecast or other information supplied. You should always seek independent advice as to your suitability to speculate in any related markets and your ability to assume the associated risks, if you are at all unsure. We are not under any obligation to update any such material. Any opinion made may be personal to the author and may not reflect the opinion of StoneX Europe Ltd.